









In the modern corporate landscape, the lexicon of user experience (UX) research has become increasingly crowded. Phrases like "data points," "research findings," and "UX insights" are frequently treated as synonyms in Slack channels and boardroom presentations. However, this linguistic conflation is more than just a minor semantic error; it is a critical vulnerability. When UX practitioners fail to distinguish between raw information and actionable wisdom, they risk having their work dismissed as anecdotal, unscientific, or—worse—irrelevant to the bottom line.
To elevate the strategic role of UX, we must first dismantle the hierarchy of research outputs and understand how to translate observations into the kind of influence that drives executive decision-making.
The Hierarchy of Evidence: Data, Findings, and Insights
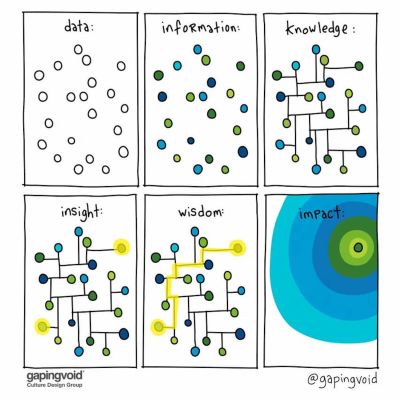
The journey from a user interaction to a business decision is a process of distillation. Each stage of this process serves a distinct purpose and carries a different weight in a professional setting.

1. Raw Data: The Building Blocks
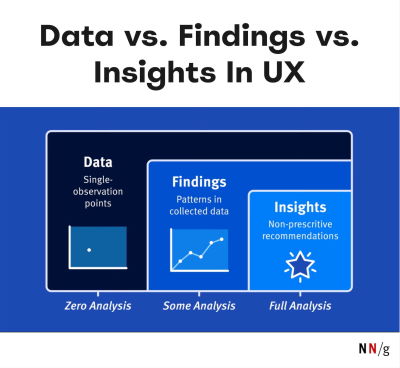
Data is the objective, uninterpreted record of behavior. It is the "what" of your research—the clicks, the timestamps, the survey responses, and the recorded video clips. On its own, raw data is essentially noise; it is neither inherently true nor false, but it is certainly incomplete. It lacks context and, most importantly, it lacks narrative.
2. Findings: The Pattern Recognition
Findings occur when you aggregate raw data to identify patterns. If data is a single point on a scatter plot, findings are the trend line drawn through those points. A finding might be: "60% of users abandoned the checkout flow at the shipping address screen." This is a significant step forward from raw data, but it still does not explain the "why."
3. Insights: The Strategic Value
Insights represent the synthesis of findings combined with domain knowledge, user psychology, and business context. An insight identifies the underlying motivation or the "root cause" of the behavior. An insight would be: "Users abandon the checkout flow at the shipping address screen because they are surprised by hidden international customs fees, which they perceive as a lack of transparency."
Insights are the only outputs that directly influence strategy. While stakeholders may tolerate raw data, they crave insights because insights provide the clarity needed to make high-stakes bets.
The "Statistical Significance" Trap
One of the most common points of friction in a UX career occurs during the inevitable, often aggressive, questioning from stakeholders: "Is this result statistically significant?"
For a UX designer or researcher, this can be a daunting moment. However, it is vital to recognize that the standard of "statistical significance" is a relic of academic, quantitative science—not a requirement for iterative product design. As noted by UX researcher Nikki Anderson, applying the rigid rules of academic hypothesis testing to qualitative UX research is a category error.
Reframing the Conversation
When you are asked about statistical significance, you are likely being challenged on the reliability of your findings. Rather than retreating, you should shift the goalpost from mathematical certainty to theoretical saturation.
- Theoretical Saturation: Explain that your goal is not to prove a universal truth with 95% confidence, but to reach the point where additional research stops yielding new, meaningful patterns.
- The Cost of Inaction: Remind stakeholders that UX research is fundamentally about risk mitigation. If ten out of ten users encounter a critical blocker that prevents them from paying you, you do not need a larger sample size to justify fixing that blocker. The cost of a bad user experience—in terms of churn and support tickets—far outweighs the cost of the research itself.
- Focus on Consistency: Instead of debating p-values, point to the consistency of the behavior. "We observed this same friction across multiple user personas, and it aligns with the negative feedback we’ve received in customer support logs."
Chronology of a Research Project: From Observation to Impact
To move from a simple test to a business-changing project, follow this professional trajectory:
- The Exploratory Phase (Data Collection): This is where you gather raw materials. Focus on volume and variety. Ensure you have diverse sources of input.
- The Synthesis Phase (Identifying Findings): Here, you move from individual interviews to collective themes. You are looking for the "What" and the "When."
- The Analysis Phase (Developing Insights): This is the "Aha!" moment. By asking "Why?" repeatedly (the Five Whys method), you move from the surface-level finding to the underlying human or system failure.
- The Communication Phase (Delivering Strategy): This is where you present your findings to stakeholders. Do not dump your raw data. Present the insight, the evidence that supports it, and the potential business impact.
Turning Findings into Actionable Insights
To avoid the pitfall of providing "weak" research, use the What-Why-So What framework. This structure ensures that your findings are always presented in a language that stakeholders—who are often preoccupied with KPIs and quarterly goals—can understand.
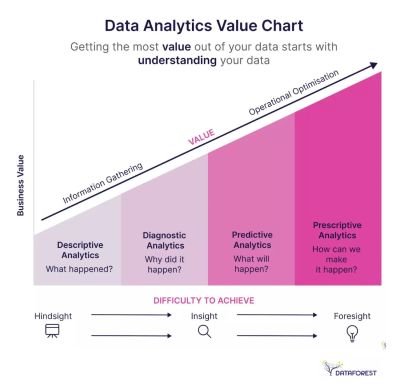
- What Happened: State the observation clearly and concisely. (e.g., "Users are unable to find the ‘Save’ button.")
- Why: Explain the root cause discovered during your research. (e.g., "The button is located below the fold on mobile devices, and the visual hierarchy directs the eye to the ‘Cancel’ button instead.")
- So What: This is the most critical section. Quantify or qualify the impact on the business. (e.g., "This design choice is contributing to a 15% increase in incomplete form submissions, which represents a potential loss of $50,000 in monthly revenue.")
By focusing on the "So What," you transform yourself from a designer who "found something" into a strategist who identified a tangible opportunity to protect or grow the business.
Implications: Moving Toward a Culture of Evidence
The ultimate goal of distinguishing between data, findings, and insights is to build trust. When an organization sees that your recommendations are backed by a rigorous process—not just a collection of random observations—they are far more likely to grant you the autonomy to iterate and innovate.
The Role of Storytelling
While data is the backbone of your argument, storytelling is the muscle. A cold, hard fact about user behavior is easily ignored. A story about a user’s journey, their frustrations, and the potential for a better future is difficult to unsee. Use your insights to paint a picture of the "Current State" versus the "Future State." Show the cost of the status quo and the ROI of your proposed solution.
Closing the Gap
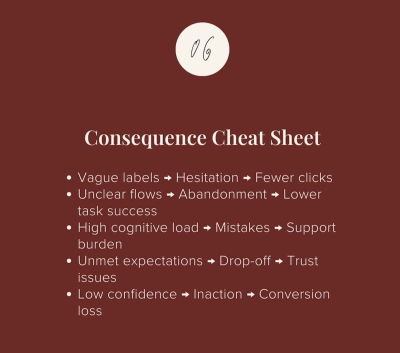
The divide between the design team and the executive suite often stems from a mismatch in language. When we talk about "UX issues," they hear "design preferences." When we talk about "business impact and reduced churn," they hear "strategic growth." By consistently delivering insights rather than raw findings, you bridge this gap.
Conclusion: The Path Forward
The distinction between data, findings, and insights is the hallmark of a mature UX professional. It is the difference between being a tactical executor and a strategic partner. As you continue to refine your process, remember that your value is not in the amount of data you collect, but in the clarity of the insights you provide.
For those looking to deepen their expertise in this area, resources such as the How to Measure UX and Design Impact course provide practical, hands-on strategies for quantifying your work. By mastering these principles, you ensure that your design recommendations are not only heard but acted upon, ultimately leading to products that are as successful as they are user-friendly.
Quick Summary of Key Concepts
- Data is the raw input; Findings are the trends; Insights are the strategic "why."
- Stop apologizing for sample sizes. Focus on theoretical saturation and the cost of inaction.
- Always use the "What-Why-So What" framework. It connects your design work to the business’s bottom line.
- Tell a story. Data points are sterile; insights about human behavior are compelling.
Need to refine your approach to measuring impact? Consider professional development tools that bridge the gap between design and business metrics to ensure your voice carries weight in every meeting.