









Updated: July 25, 2025
Author: Josh Gallant (Founder, Backstage SEO)
Data Source: Unbounce Conversion Benchmark Report

Main Facts: Setting the Baseline for Modern Conversion Metrics
In the high-stakes arena of digital marketing, the adage "not all conversions are created equal" serves as a foundational truth. For years, digital strategists have searched for a singular benchmark—a magical conversion percentage that signals campaign success. However, according to comprehensive data compiled in Unbounce’s latest Conversion Benchmark Report, a one-size-fits-all metric is a dangerous myth.

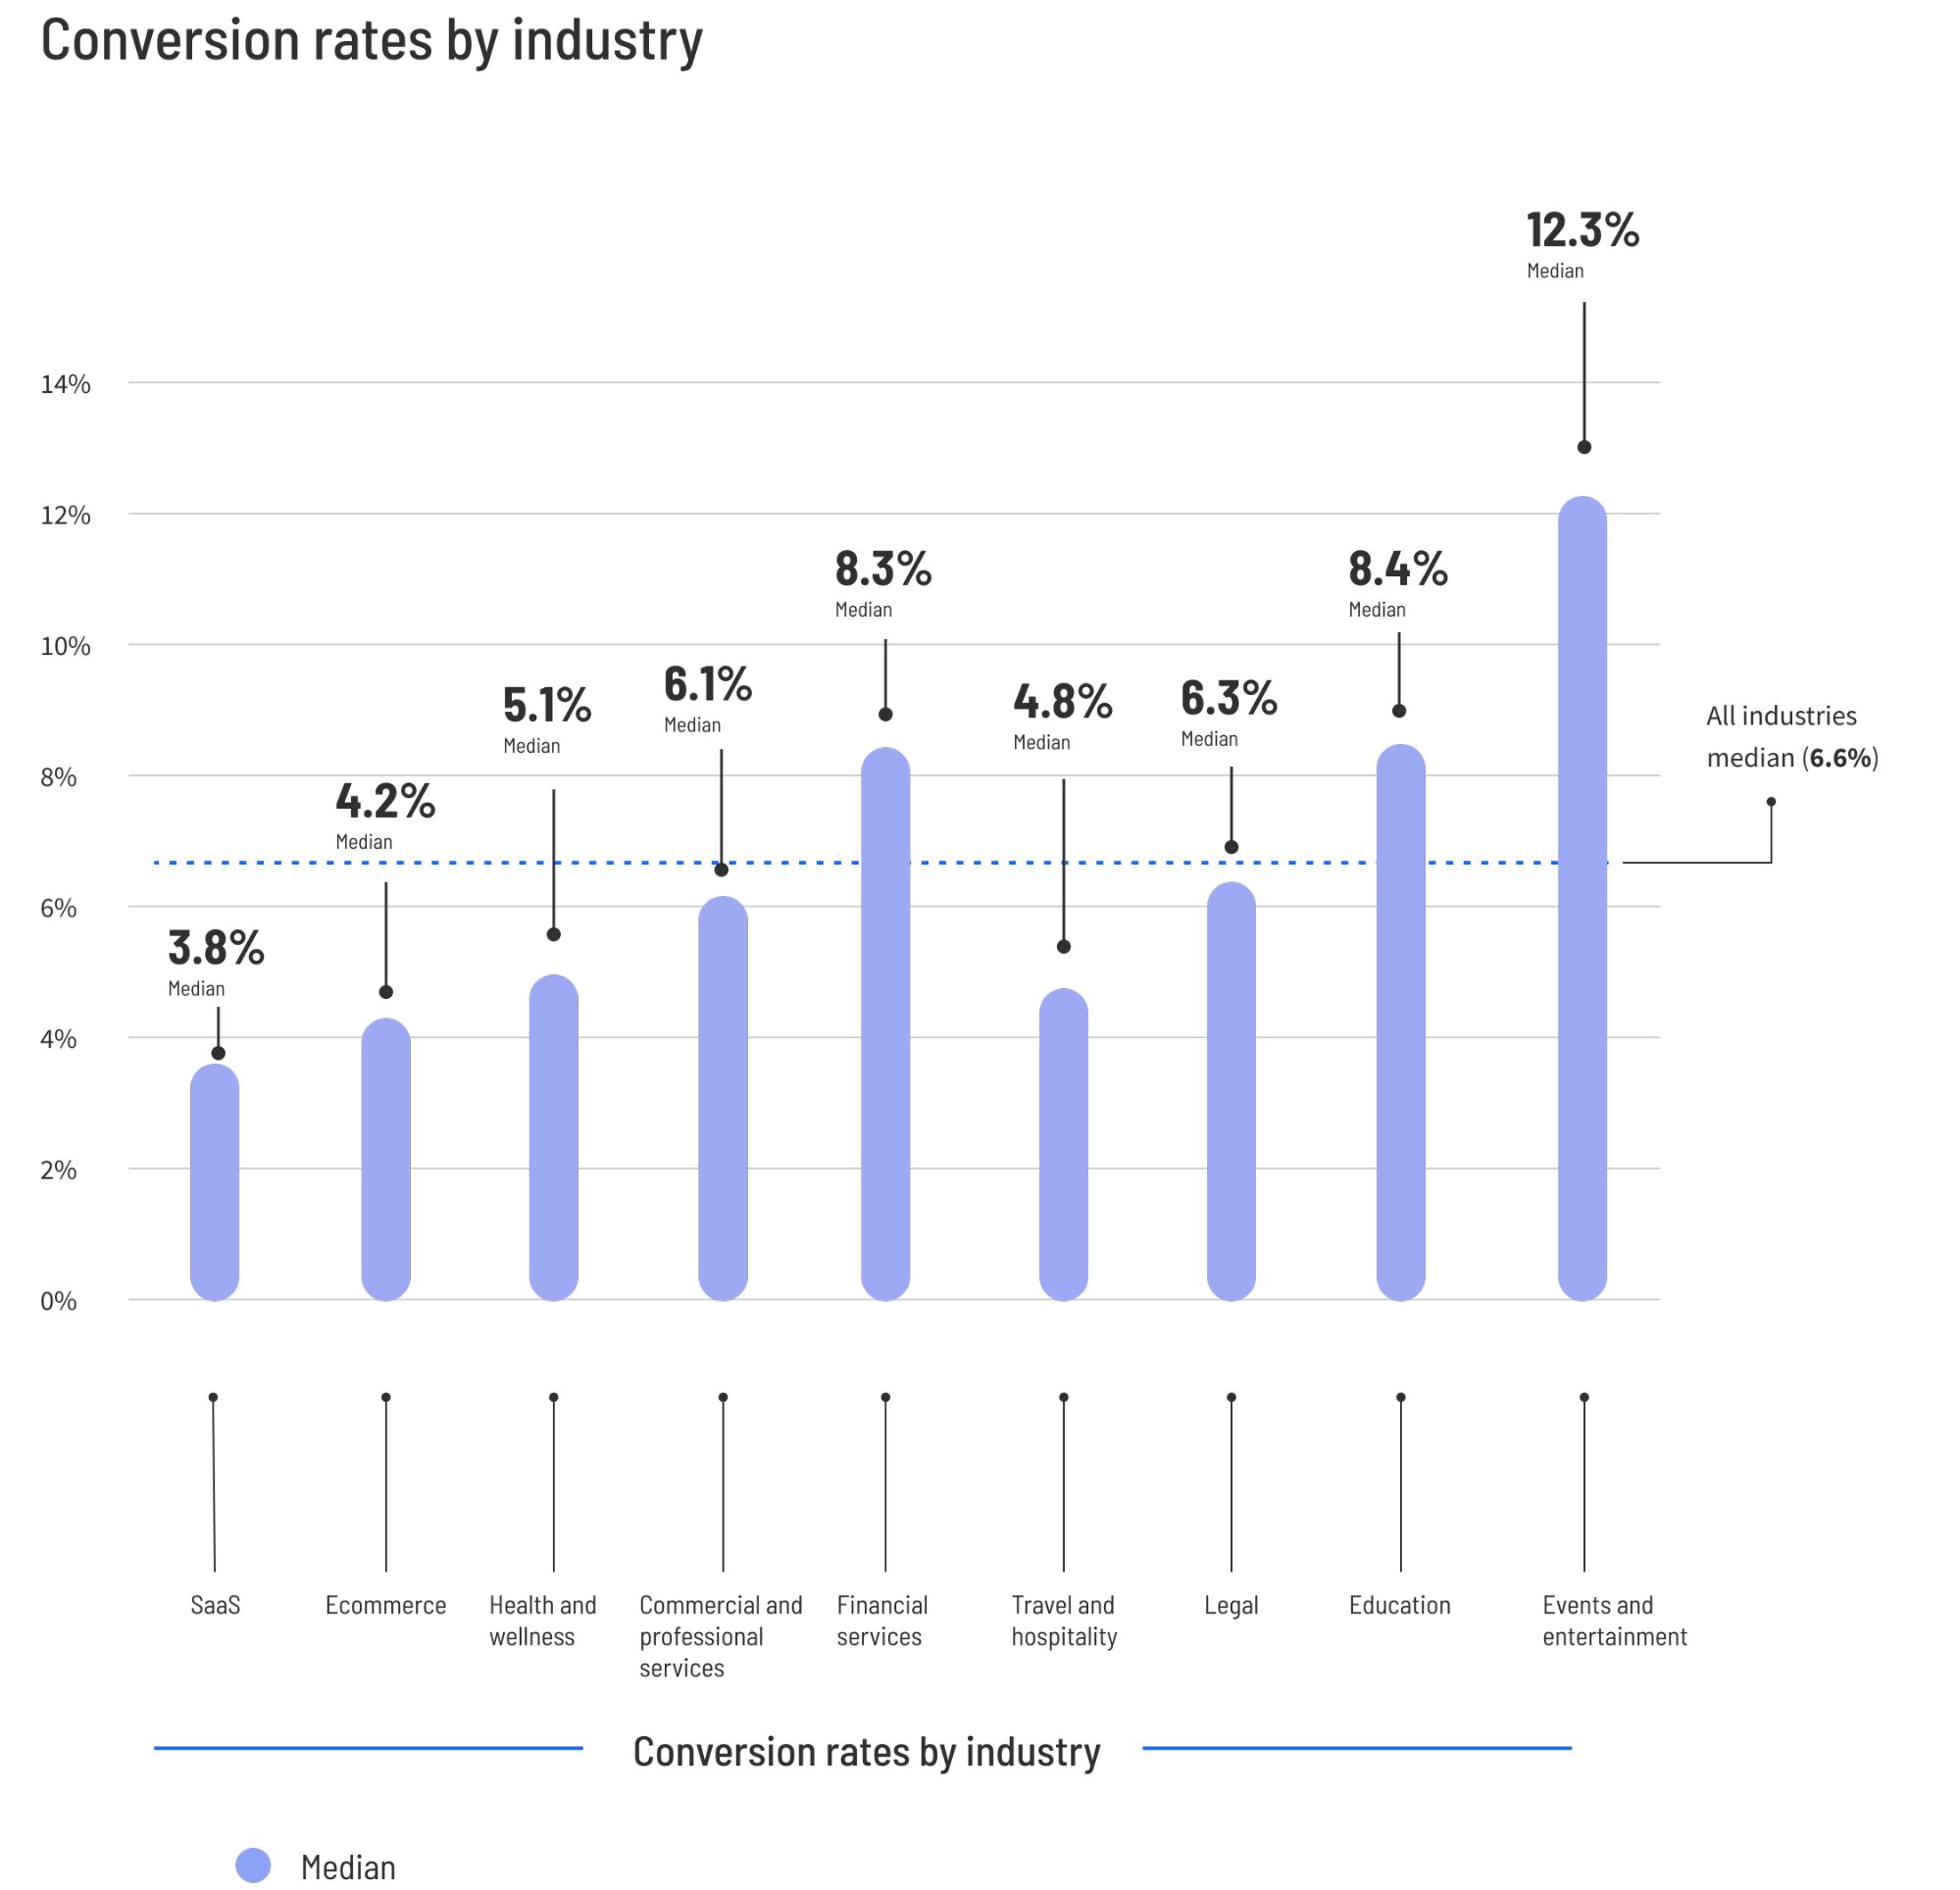
Based on an exhaustive dataset analyzing over 57 million conversions, 41,000 landing pages, and 464 million pageviews, the median conversion rate across all industries sits at 6.6%.
While this figure offers a convenient middle-of-the-pack reference point, experts warn against treating it as an operational target. Just as human height averages fail to capture the demographic nuances of elite athletes versus toddlers, a generalized conversion baseline tells marketers very little about what constitutes success within their specific vertical. True optimization demands contextual awareness, factoring in user intent, device preferences, acquisition channels, and industry-specific consumer behavior.
Chronology and Evolution of Conversion Benchmark Analysis
The understanding of digital conversion rate optimization (CRO) has undergone a profound evolution over the past decade:
- The Early Era of Guesswork (Early 2010s): Marketers relied heavily on gut feelings, generic web forums, and widely circulated urban legends (such as the universal "2% conversion rule") to gauge campaign health.
- The Rise of Aggregate Analytics (Mid-to-Late 2010s): Platforms began aggregating data, introducing the concept of industry averages. However, these early metrics were frequently skewed by arithmetic means—allowing massive enterprise "unicorn" pages or broken, low-traffic pages to distort the realistic picture.
- The Shift to Statistical Medians (2020s–Present): Industry analysts shifted toward using median values rather than averages. By filtering out statistical outliers, researchers provided digital marketers with a true middle-of-the-pack reflection of everyday campaign performance. The 2024–2025 benchmark reports cemented the understanding that top-tier performance (the 75th percentile) requires hyper-targeted, industry-specific strategies rather than broad-brush applications of "best practices."
Supporting Data: Industry-by-Industry Performance Breakdown
To accurately evaluate performance, marketers must look past the global median and examine how individual sectors behave. A "good" conversion rate—defined here as the 75th percentile threshold separating the top-performing quarter of pages from the rest—varies wildly depending on the market.
1. Ecommerce: Navigating High-Volume Retail
- Median Conversion Rate: 4.2%
- Top 25% Threshold ("Good"): 11.4% or higher
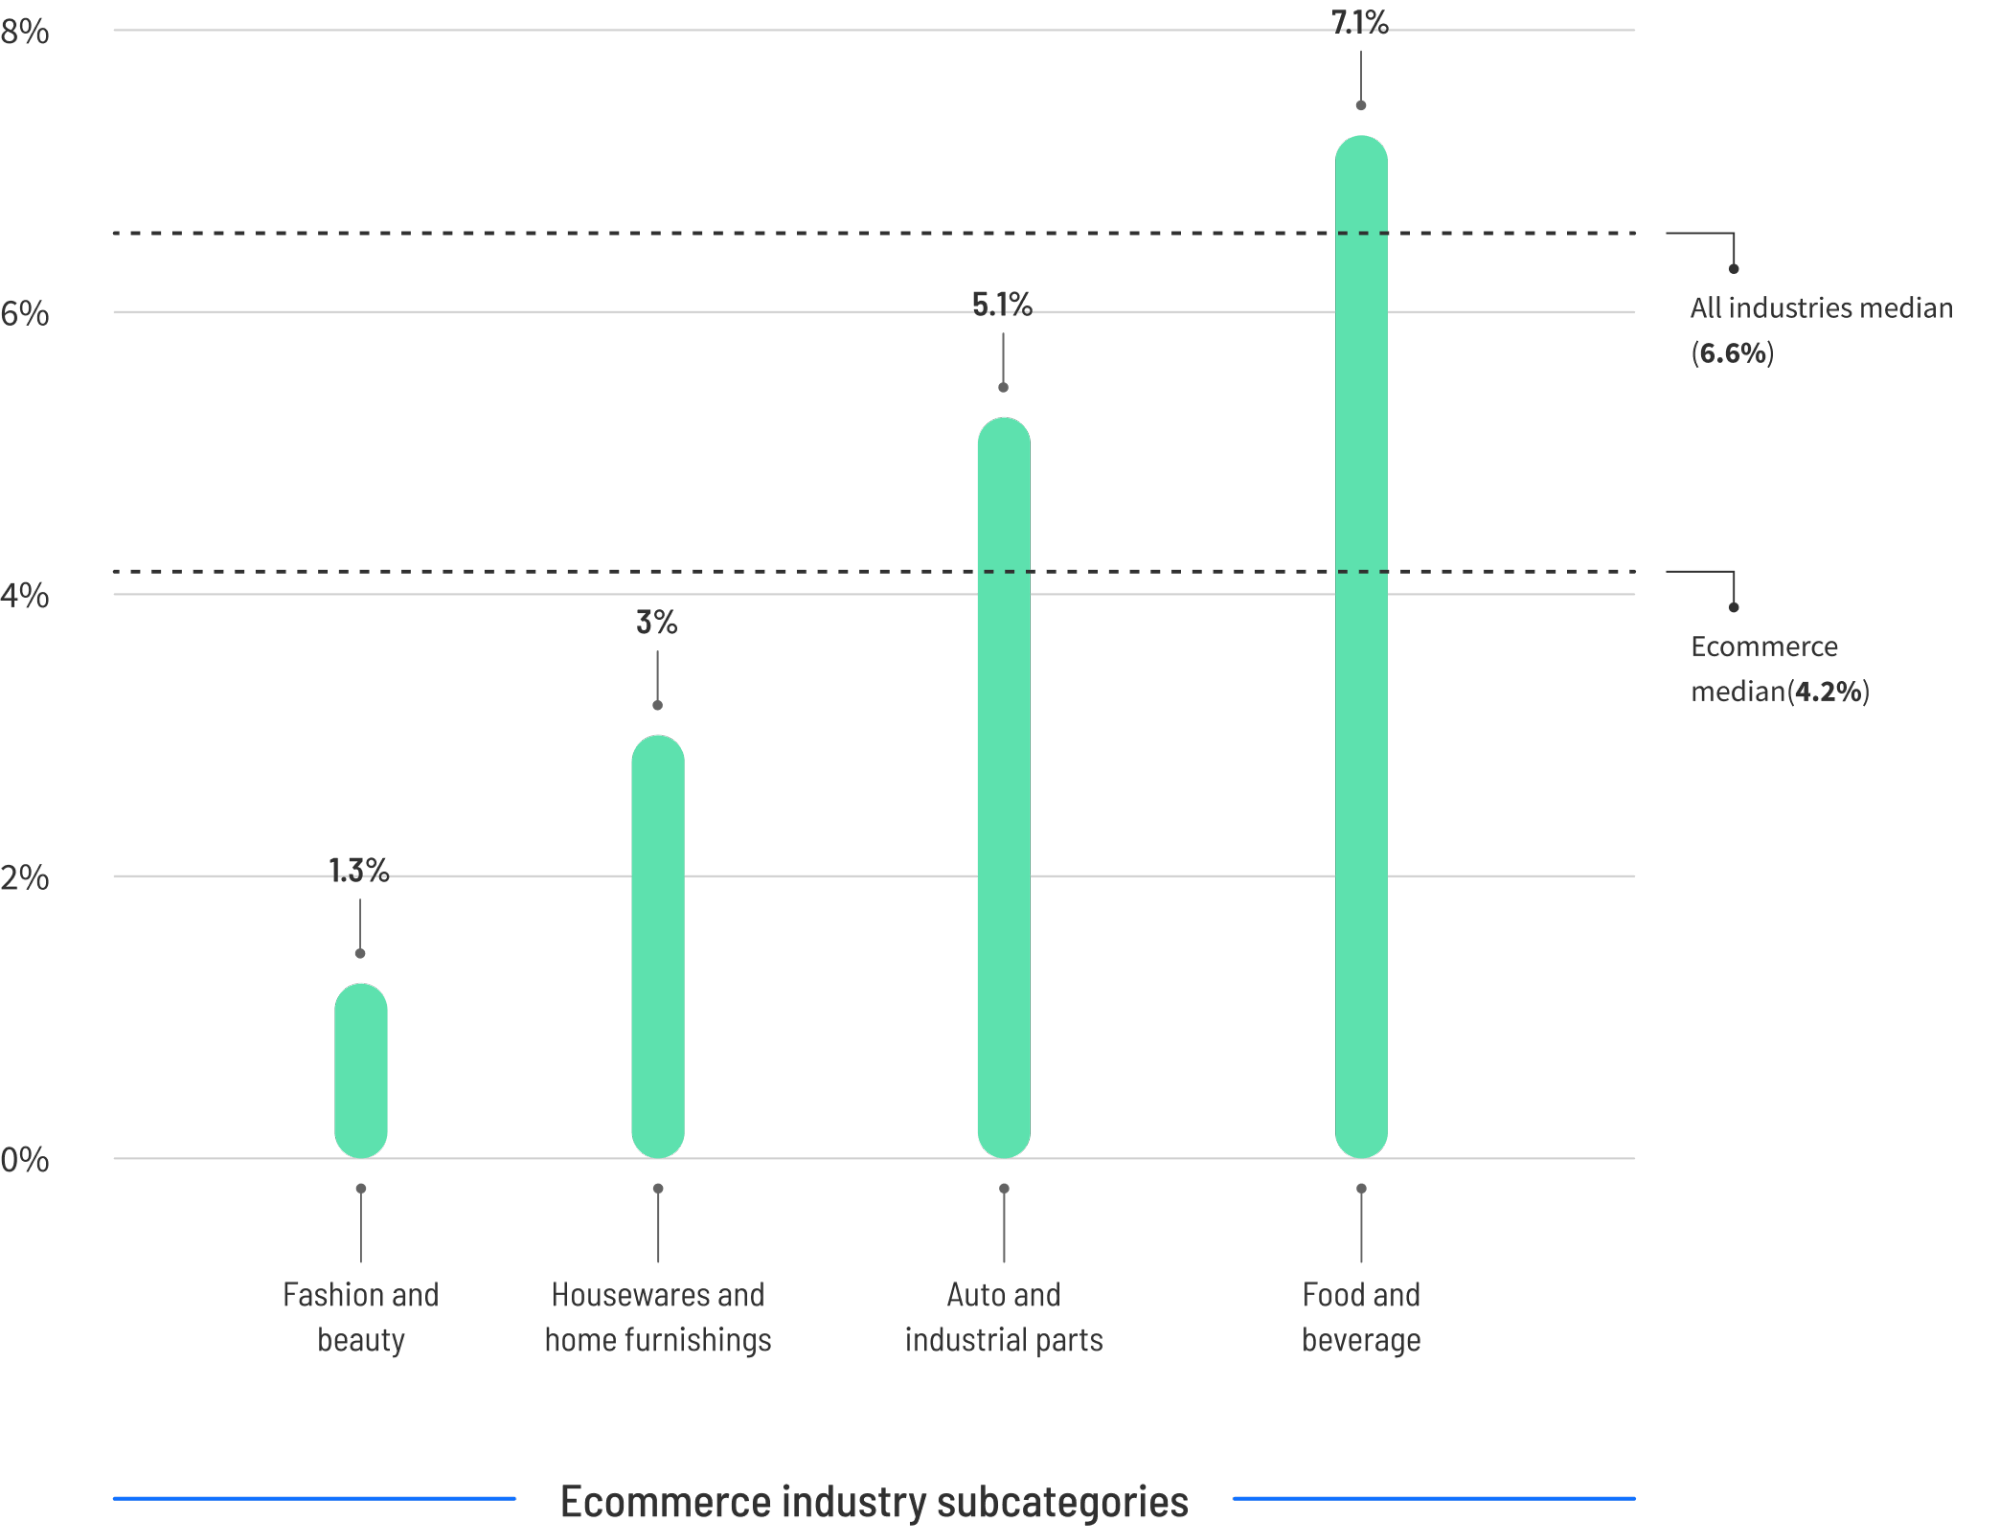
- Context: While the median sits below the global average, top-tier ecommerce pages achieve nearly triple that rate. Niche differences are stark: food and beverage pages command a robust 7.1% median, whereas fashion and beauty sectors hover near a 1.3% median due to high browse-and-abandon rates.
2. Software as a Service (SaaS): Managing Long Sales Cycles
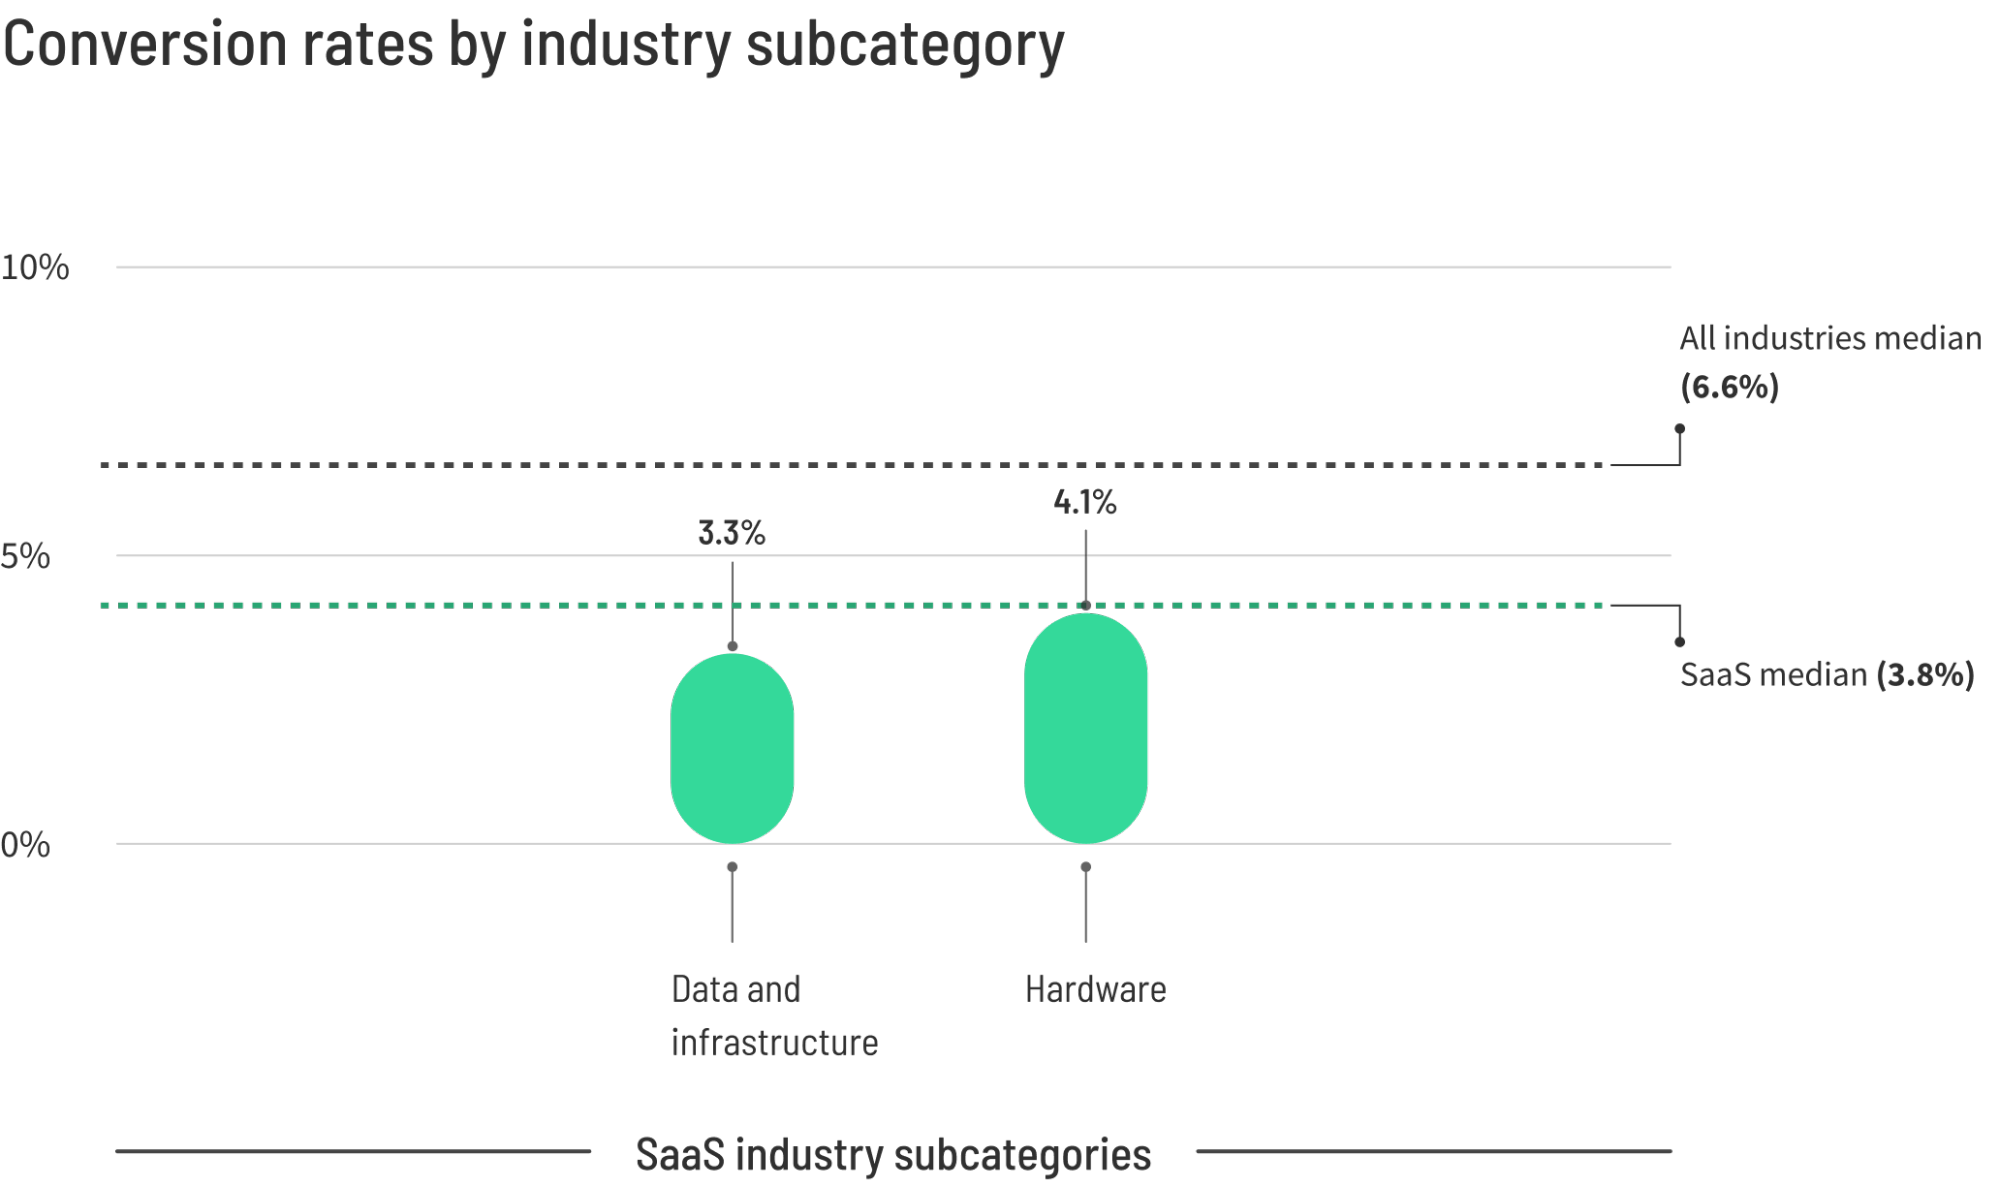
- Median Conversion Rate: 3.8%
- Top 25% Threshold ("Good"): 11.6% or higher
- Context: SaaS landing pages face distinct hurdles, promoting complex solutions to audiences with fragmented purchase intent. Hardware-focused SaaS edges out data and infrastructure platforms (4.1% vs. 3.3% median). High performers bridge the gap by leaning heavily on risk-reversal tactics, such as credit-card-free trials.
3. Professional Services: Expertise and Urgency
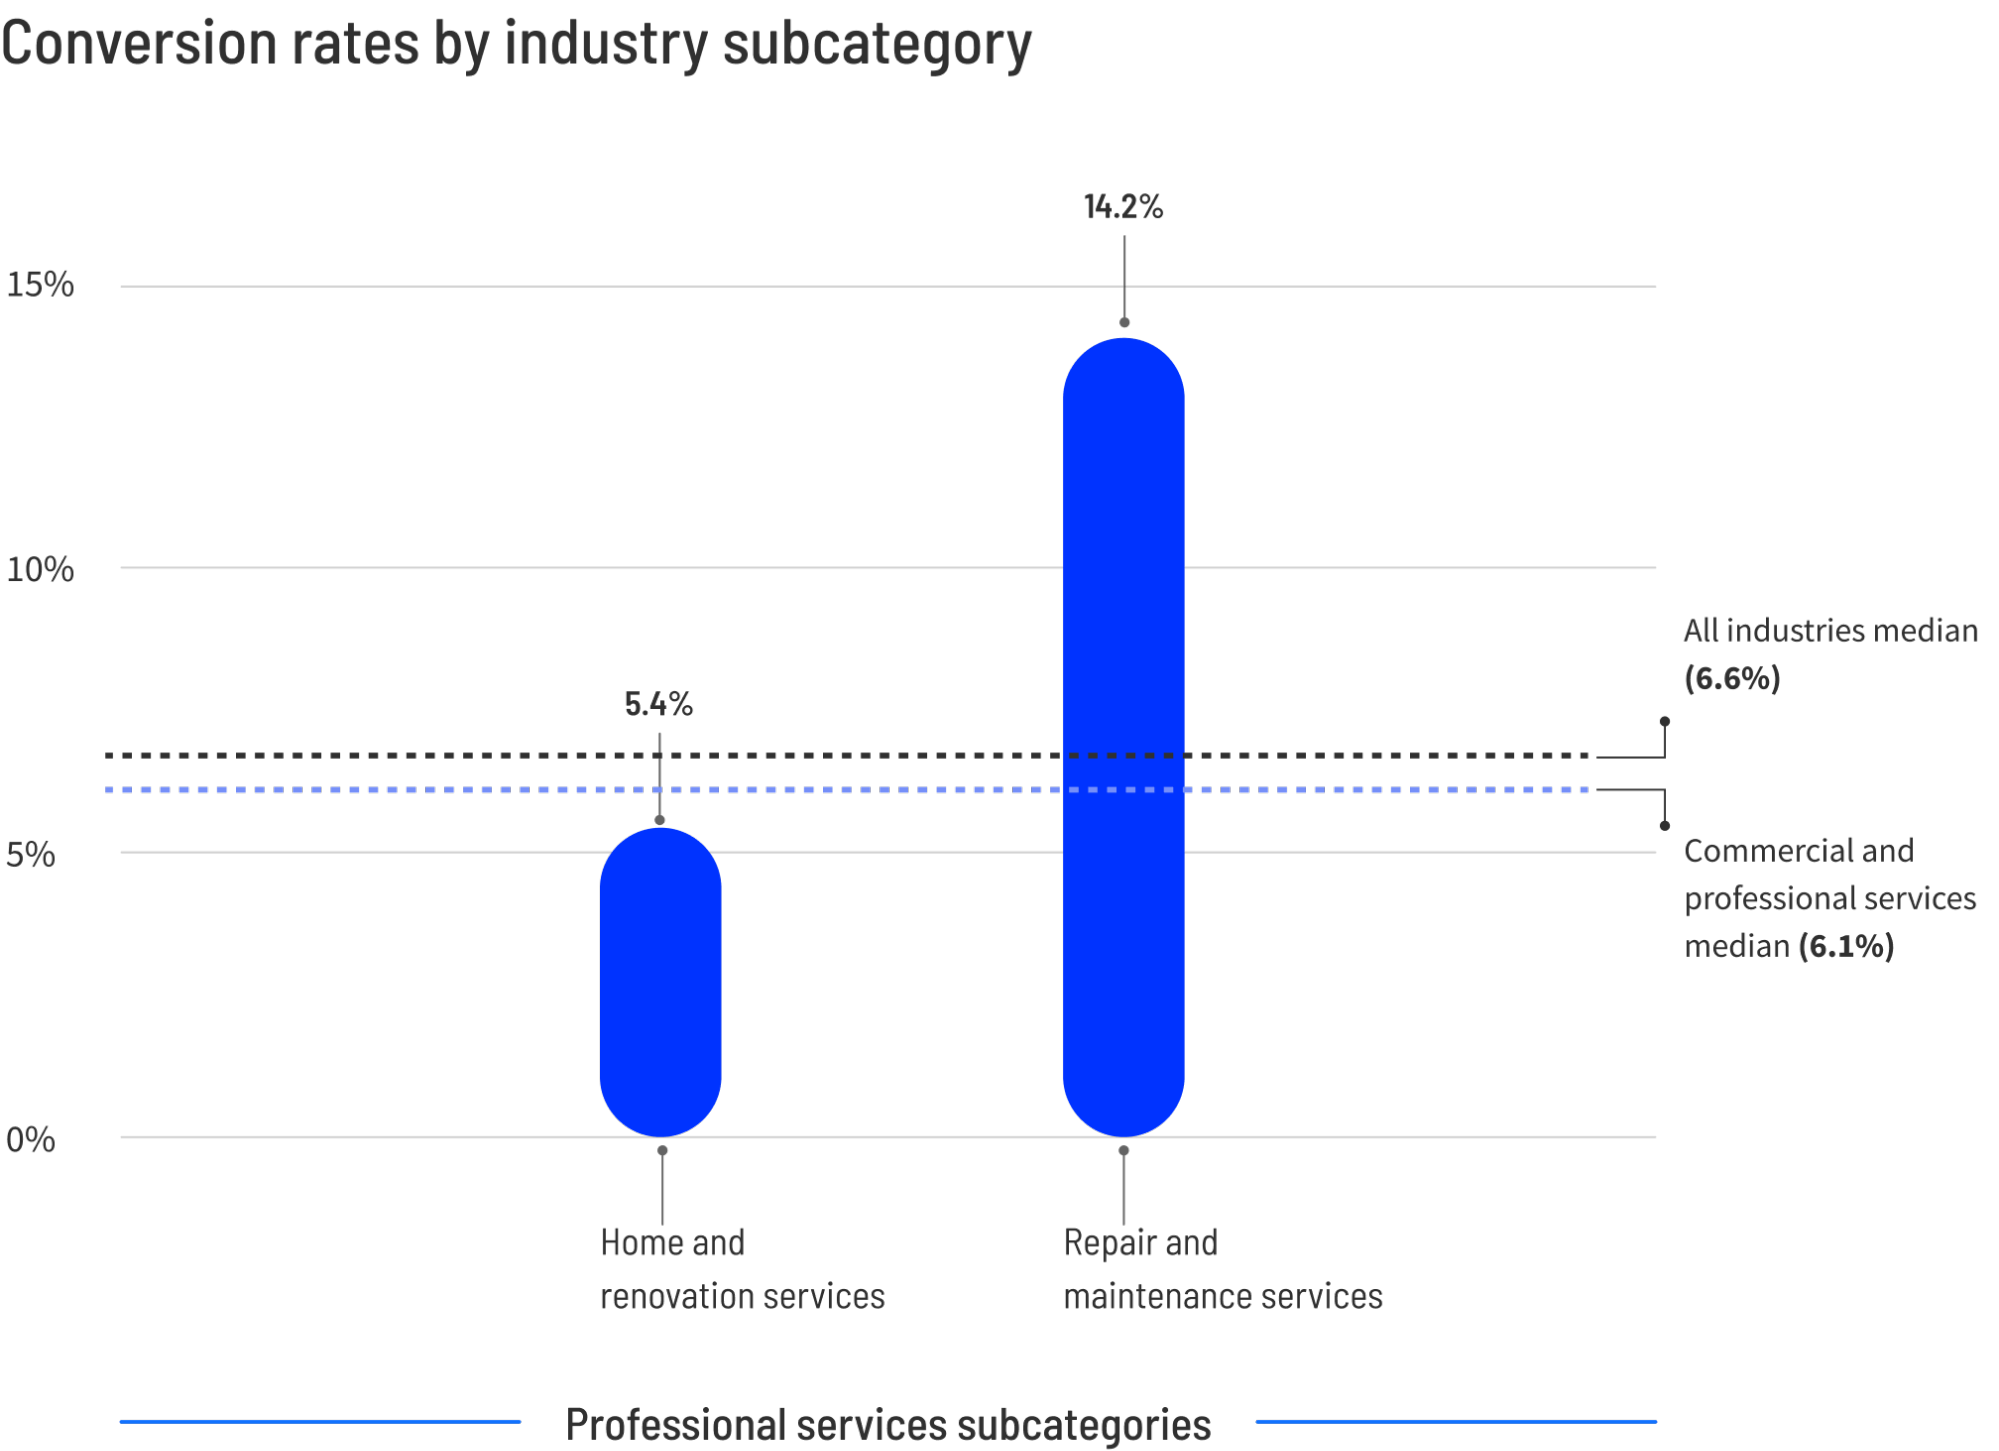
- Median Conversion Rate: 6.1%
- Top 25% Threshold ("Good"): 14.1% or higher
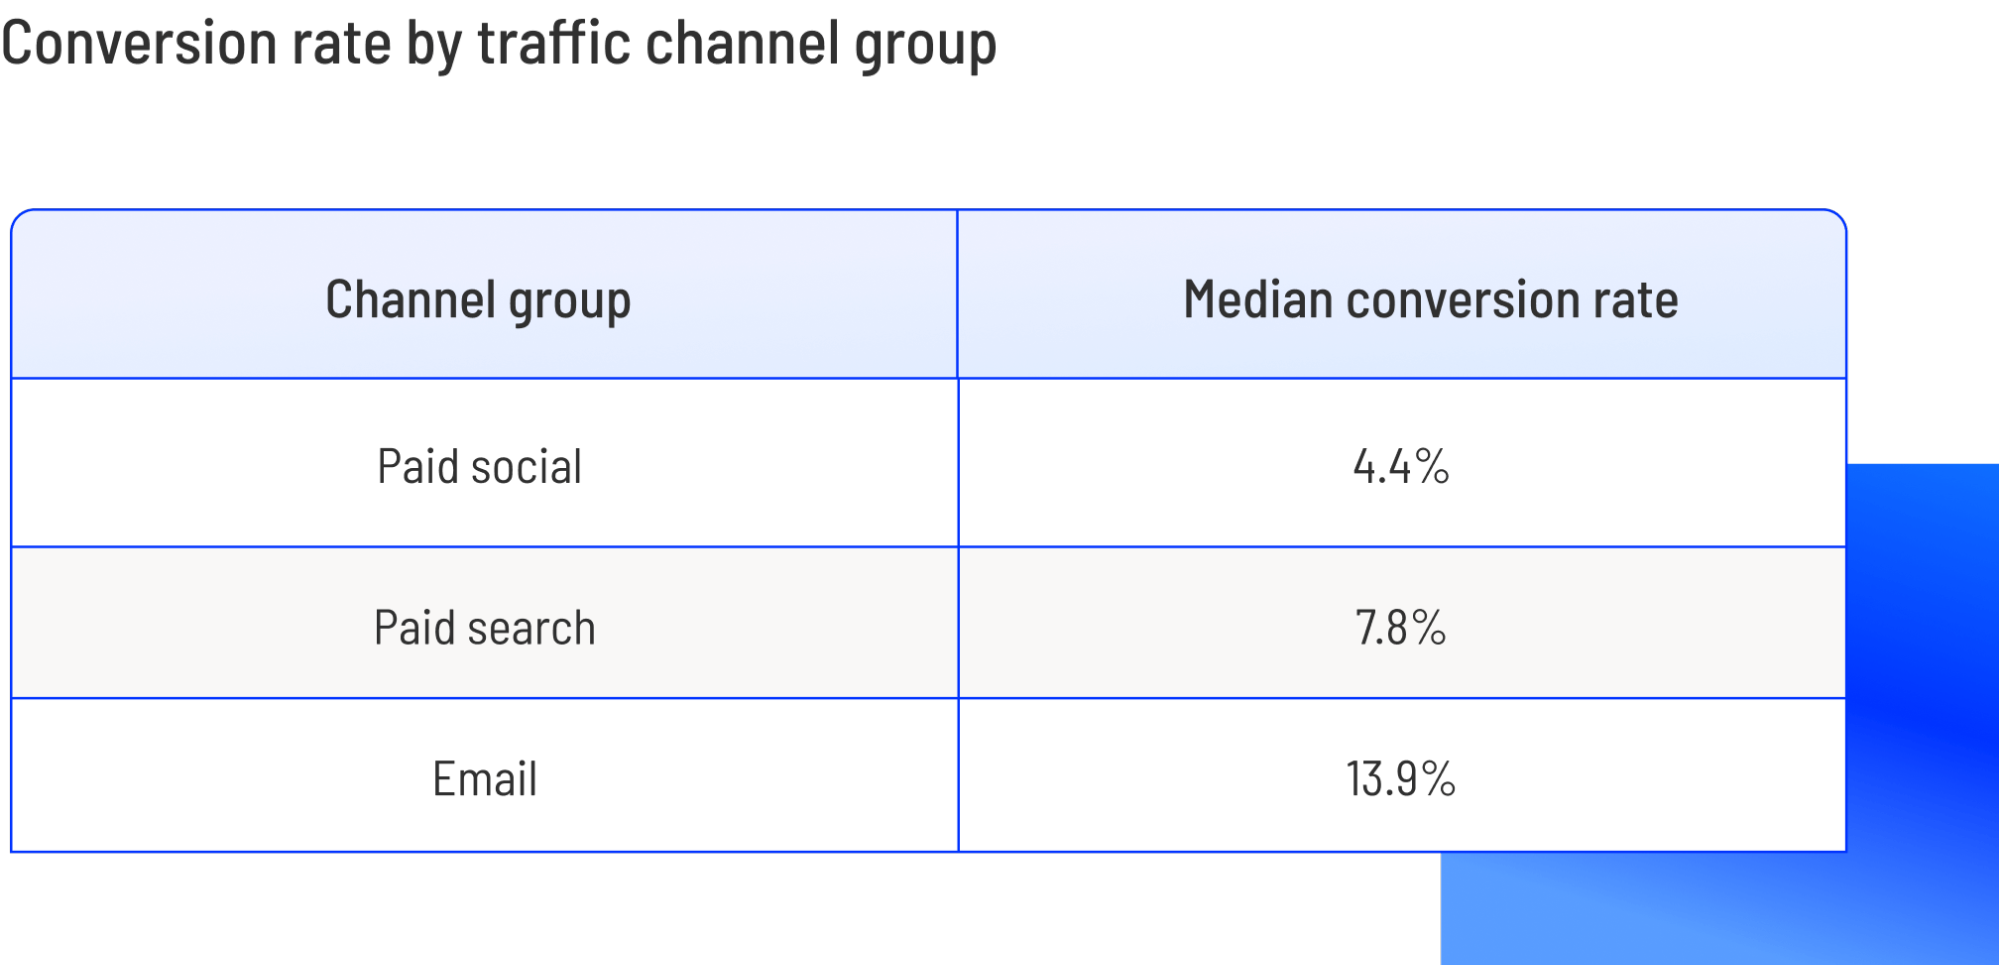
- Context: Professional services cover a diverse landscape, from corporate consulting to home maintenance. Notably, repair and maintenance pages convert nearly three times better than home renovation pages—driven purely by consumer urgency (a burst pipe vs. a planned kitchen remodel). Furthermore, traffic source dictates success here: email channels convert at nearly 14%, while paid social lags at 4.4%.
4. Financial Services and Insurance: High Intent, Heavy Regulation
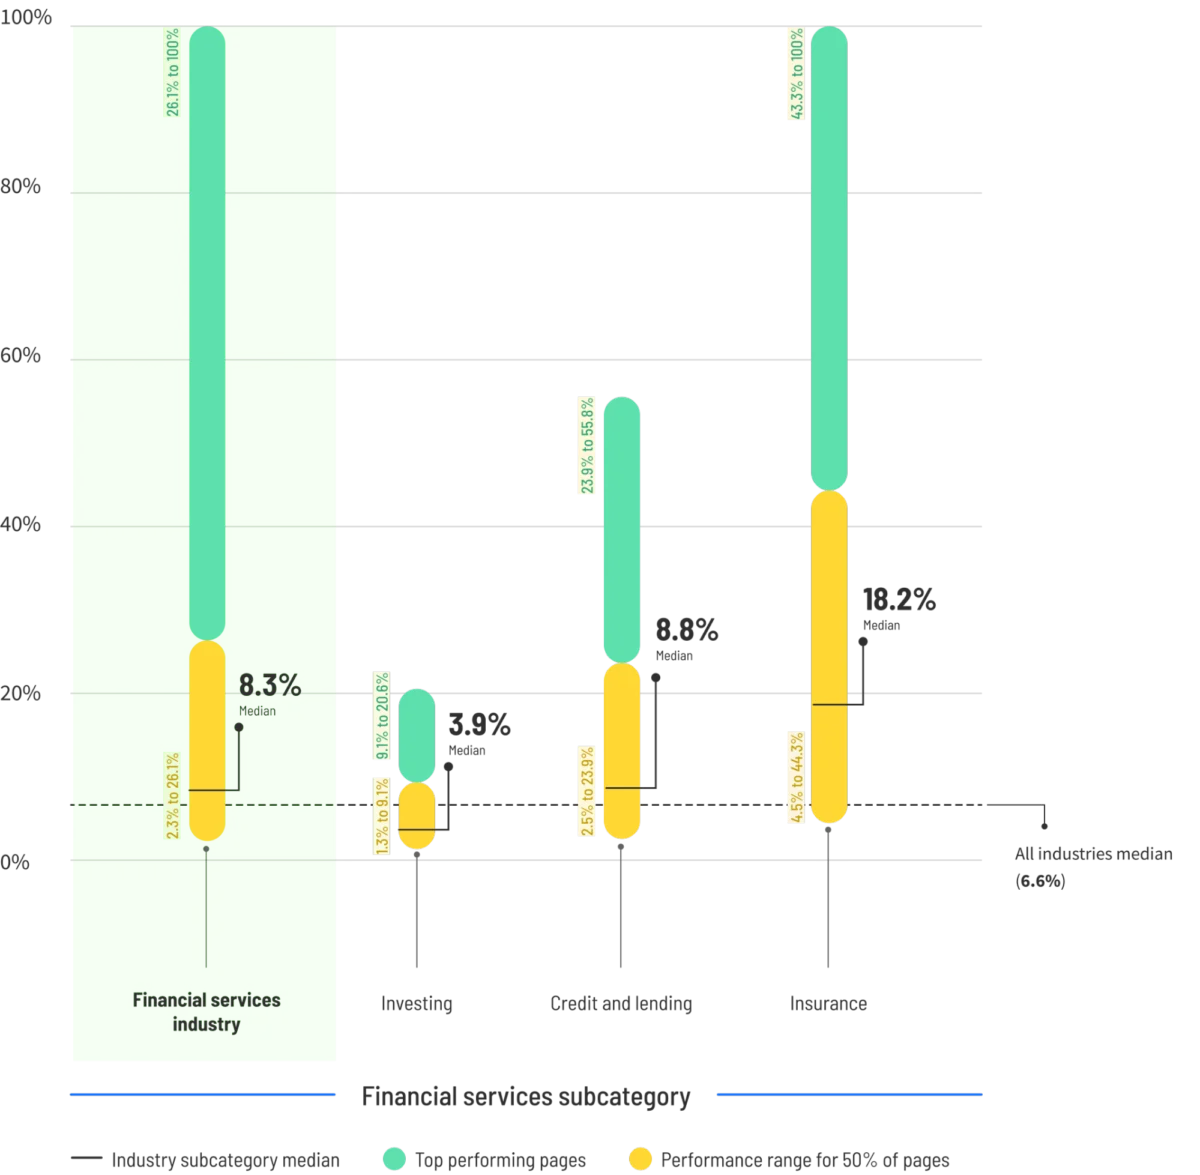
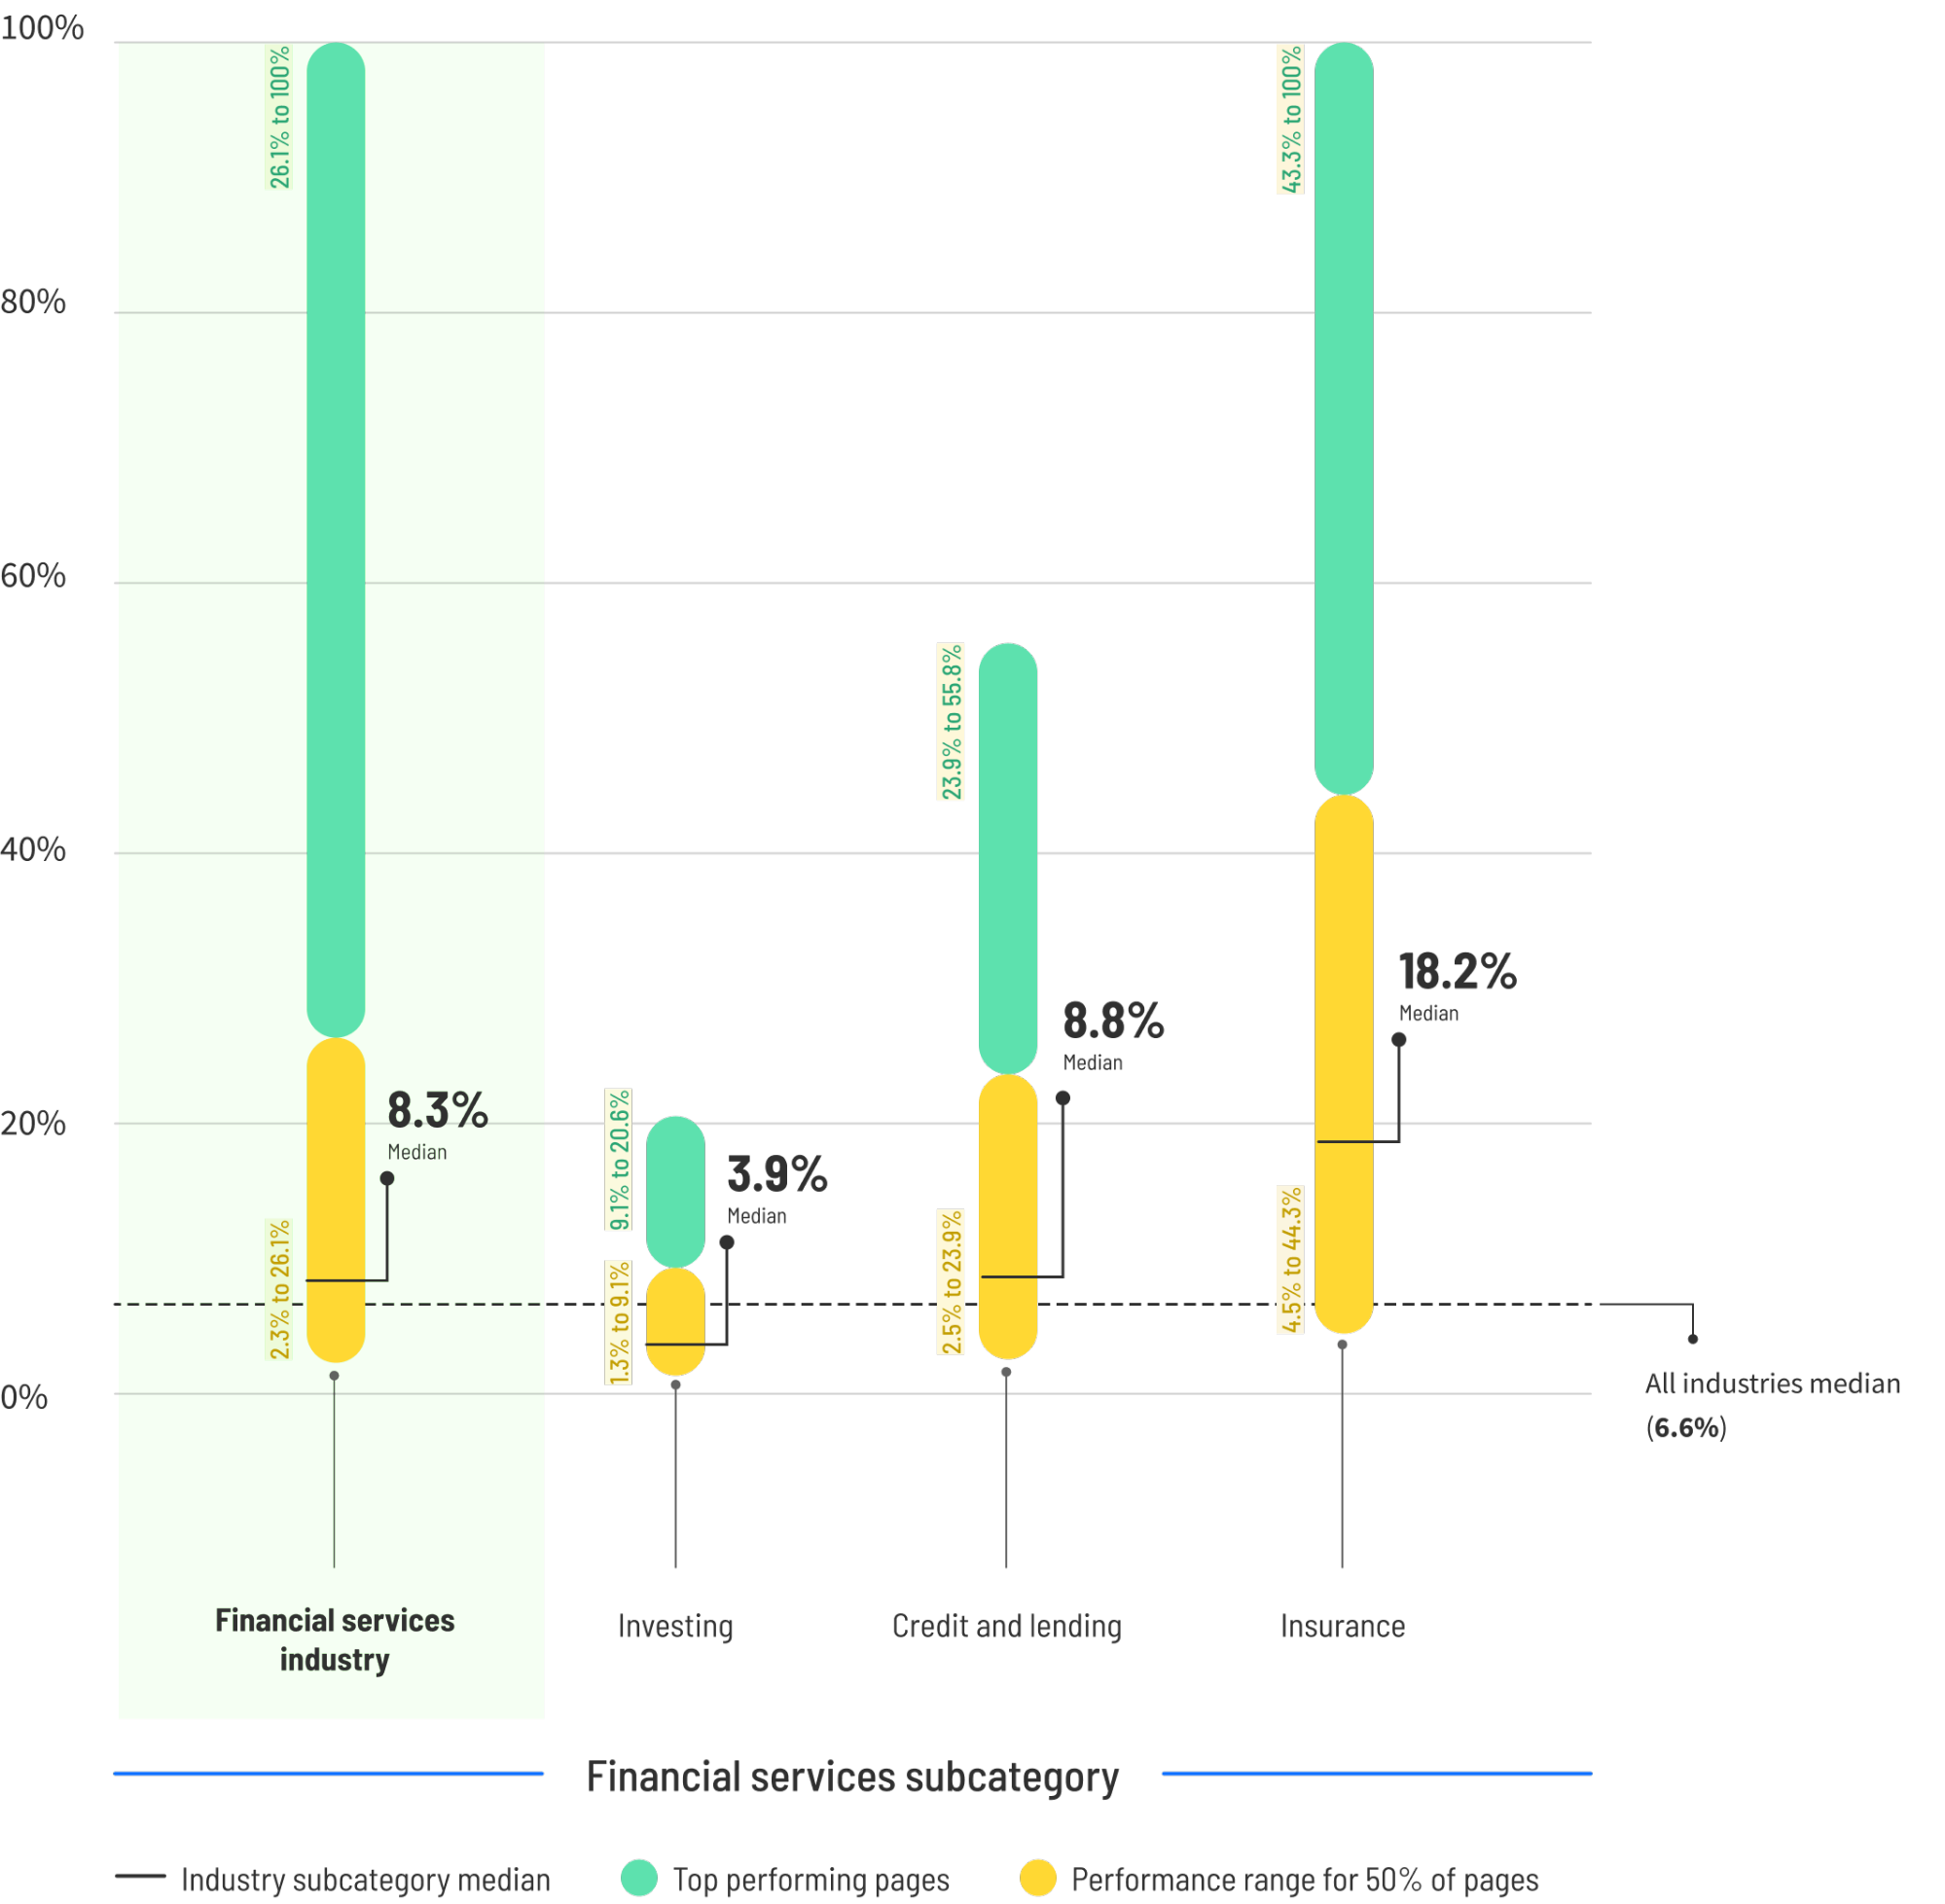
- Median Conversion Rate: 8.3%
- Top 25% Threshold ("Good"): Varies significantly by sub-vertical (Insurance spikes at 18.2%, while investing pages sit at 3.9%).
- Context: Financial products require high-consideration decision-making, driving higher baseline engagement. Interestingly, mobile traffic converts 27.8% better than desktop in financial services—defying the cross-industry norm and highlighting the importance of mobile-first design for modern fintech and insurance seekers.
5. Travel and Hospitality: Seasonality and Consideration
- Median Conversion Rate: 4.8%
- Top 25% Threshold ("Good"): 15.6% or higher
- Context: Accommodations struggle at a 3.7% median due to extensive comparison shopping, while transportation and travel services hit 14.8%. Desktop traffic dominates final conversions in this space, outperforming mobile by 10.4%, even though much of the initial research occurs on smartphones.
6. Legal Services: The Mobile Urgency Factor
- Median Conversion Rate: 6.3%
- Top 25% Threshold ("Good"): 13.1% or higher
- Context: Legal landing pages buck conventional desktop trends by converting at 21% on mobile versus 15.9% on desktop. When individuals experience a vehicular accident, an urgent legal notice, or an arrest, they seek counsel immediately from their mobile devices. Consequently, paid search traffic converts nearly twice as well as other acquisition channels.
7. Education: Selling Transformation
- Median Conversion Rate: Varies widely (Online courses lead at 18.3%, general courses at 13%, higher education at 6.3%).
- Top 25% Threshold ("Good"): 20% or higher
- Context: Education marketers excel by selling direct transformations ("Learn a skill in 30 days") rather than abstract institutional prestige. Email remains the dominant traffic channel here, converting at 14.1% compared to 7.3% for paid search.
8. Entertainment: The Sweepstakes Phenomenon
- Median Conversion Rate: Highly polarized
- Top 25% Threshold ("Good"): 40.8% or higher
- Context: Driven largely by sweepstakes landing pages—which boast a staggering 47.5% median conversion rate due to low-friction engagement requirements (e.g., submitting an email for a prize draw)—entertainment benchmarks must be evaluated strictly against the complexity of the conversion action.
Official Industry Insights and Strategic Recommendations
Industry analysts and CRO practitioners emphasize that understanding benchmarks is merely the starting point. To bridge the gap between average performance and top-tier excellence, experts recommend a systematic focus on five core optimization strategies:
- Simplify Copy to a 5th–7th Grade Reading Level: Data reveals that content written in accessible, jargon-free language converts at 11.1%—outperforming 8th-9th grade copy by 56% and doubling the conversion rate of overly academic or "professional" phrasing.
- Iterative A/B Testing: Rather than overhauling entire sites, marketers should isolate variables—testing button colors, headline phrasing, and form field lengths one element at a time.
- Deploy Strategic Social Proof: Consumer trust relies heavily on peer validation. Testimonials, review counts, and verified client logos must be placed adjacent to conversion points rather than buried in footers.
- Rigorous Mobile Optimization: With mobile devices accounting for 83% of all landing page visits, ensuring lightning-fast load times and frictionless mobile UX is non-negotiable—particularly in mobile-first sectors like legal and finance.
- Eliminate Friction and Distractions: Removing superfluous navigation menus, outbound links, and competing CTAs ensures that visitors remain singularly focused on the primary conversion goal.
Implications for Modern Marketers
The persistent gap between median conversion rates and top-quartile performance represents a massive, untapped revenue opportunity across the global digital economy. The organizations capturing this upside are not necessarily those with the largest ad budgets; rather, they are the teams that approach conversion rate optimization with scientific rigor.
By aligning messaging clarity, page-load velocity, trust signals, and user intent, marketers can systematically transform average campaigns into high-yielding engines of growth. As the digital landscape continues to mature in 2025 and beyond, the mandate for brands is clear: stop chasing generic internet averages, understand the unique behavioral patterns of your specific audience, and never stop testing.