









By Josh Gallant
Updated July 25, 2025 | 13 min read
Not all conversions are created equal—and neither are conversion rates.

When digital marketers discuss performance, the number that counts as "good" is rarely a one-size-fits-all metric. It fluctuates wildly depending on the industry, the target audience, and the initial traffic acquisition channel. To understand what constitutes a winning strategy, marketers must look beyond generic internet baselines and dive into granular, empirical data.
Every statistic in this analysis stems directly from Unbounce’s comprehensive 2024 Conversion Benchmark Report. Based on an exhaustive dataset pulling from over 57 million conversions, 41,000 landing pages, and 464 million pageviews, this report sheds light on the mechanical realities of digital conversion rate optimization (CRO) today.

Main Facts: Understanding Baselines and Medians
To contextualize performance, professionals must first grasp the difference between a baseline median and a top-tier benchmark.
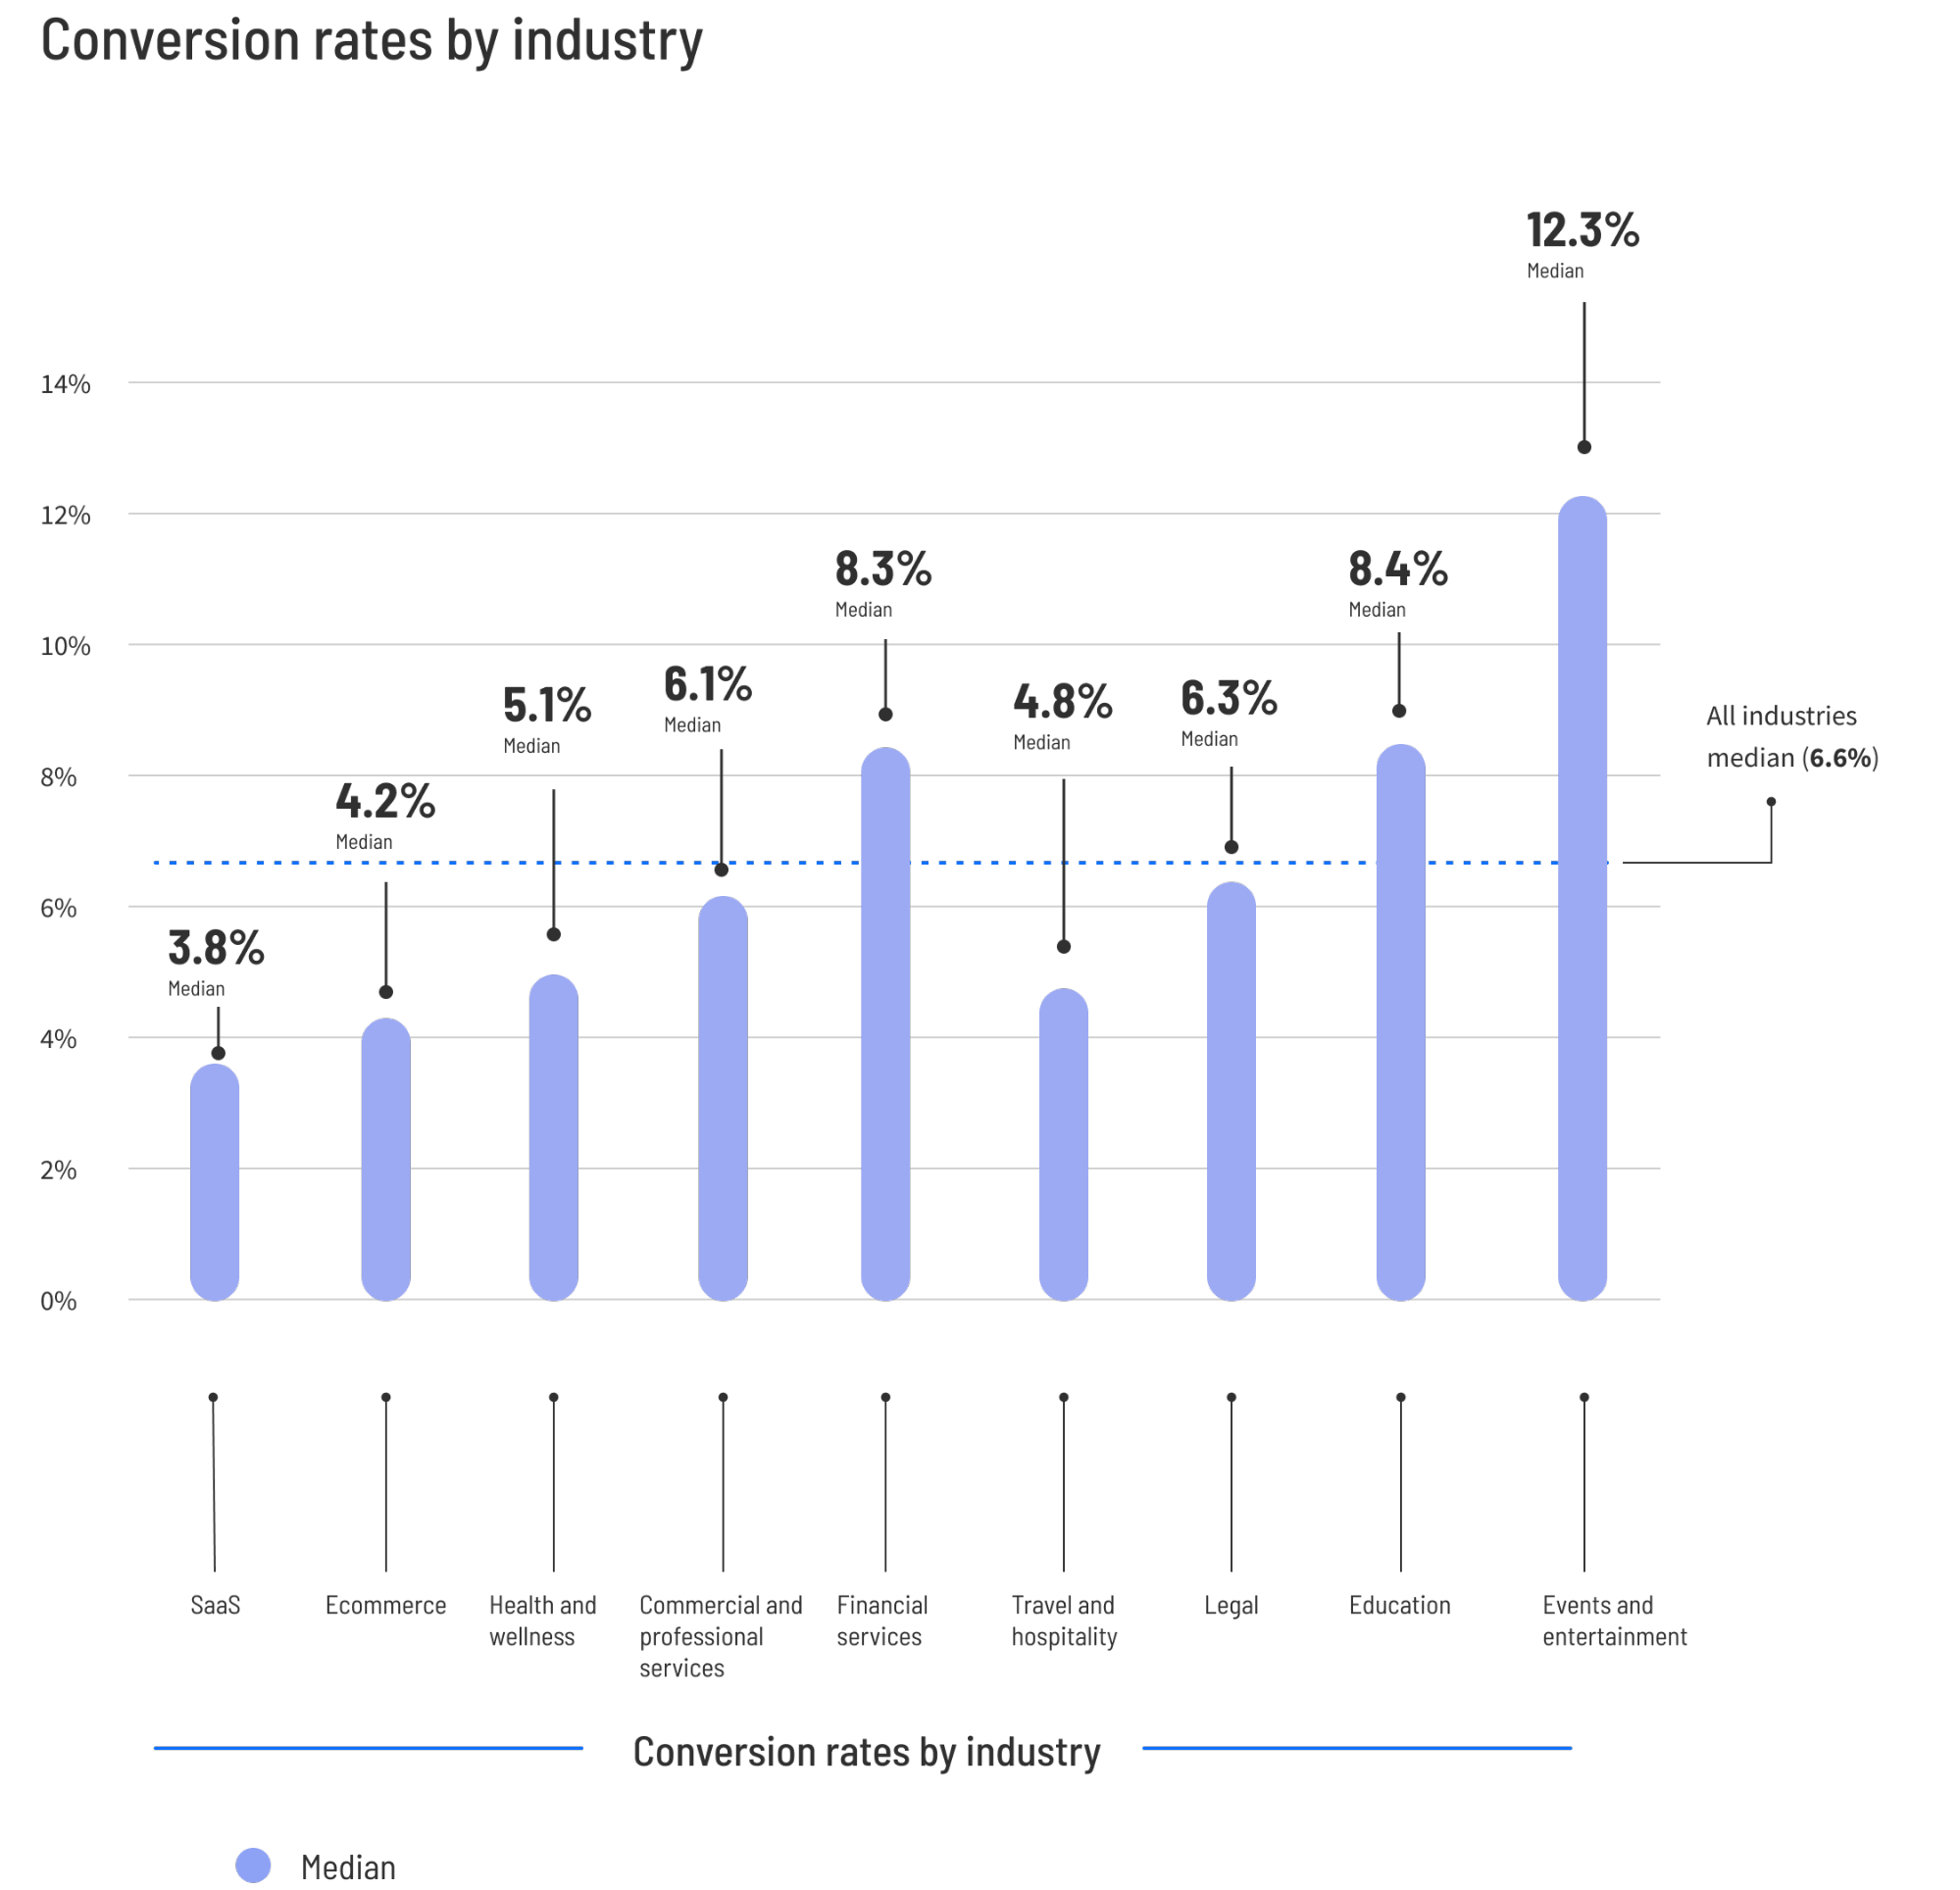
Across all industries analyzed in the Unbounce dataset, the median conversion rate for landing pages sits at 6.6%. This acts as the middle-of-the-pack anchor point—a general reference marker. However, treating this 6.6% figure as a universal performance goal is a mistake.
Think of it like the average height of a human being: it is a numerical reality, but it tells you very little about what is normal or exceptional for your specific demographic. Success in CRO depends entirely on tailoring strategies to distinct industry nuances rather than chasing arbitrary averages.
What Constitutes a "Good" Conversion Rate?
A genuinely good conversion rate starts at 11.4% and can climb as high as 40.8%, depending entirely on the vertical. These figures represent the 75th percentile floor. To join the top-performing 25% of pages within any given field, a marketer must consistently beat these benchmarks.
Why do these margins vary so dramatically? The divergence comes down to user intent, campaign architecture, and audience expectations. A software-as-a-service (SaaS) company promoting a complex enterprise solution plays an entirely different game than an e-commerce brand running a flash sale on consumer goods.
Chronology & Methodology: Why Medians Matter
When analyzing digital marketing datasets, statisticians face a fundamental choice: use averages (means) or medians. The Conversion Benchmark Report relies strictly on median values for a vital reason.
To visualize the problem with averages, imagine placing billionaire Jeff Bezos in a room with ten schoolteachers. The "average" salary in that room would soar into the millions, yet the "median" salary would accurately reflect a teacher’s actual earnings. Medians prevent data from being violently skewed by rare "unicorn" pages converting at 90% or poorly configured pages stalling out at 0.001%.
With a sample size exceeding 41,000 landing pages, the median establishes the true middle of the pack. For practical applications, marketers can use these medians as realistic comparisons against their own internal metrics.
Supporting Data: Industry-by-Industry Breakdown
Comparing a business’s conversion rate to a generic internet average is like comparing a single apple to the entire produce section. Below is how the numbers break down across major commercial sectors.
1. E-Commerce Conversion Rates
- Median Conversion Rate: 4.2%
- Top-Tier Benchmark (75th Percentile): 11.4% or higher
E-commerce landing pages span everything from fast fashion to heavy electronics. If an online store converts above 4.2%, it is already outperforming half the market. However, top-tier performers nearly triple that median.
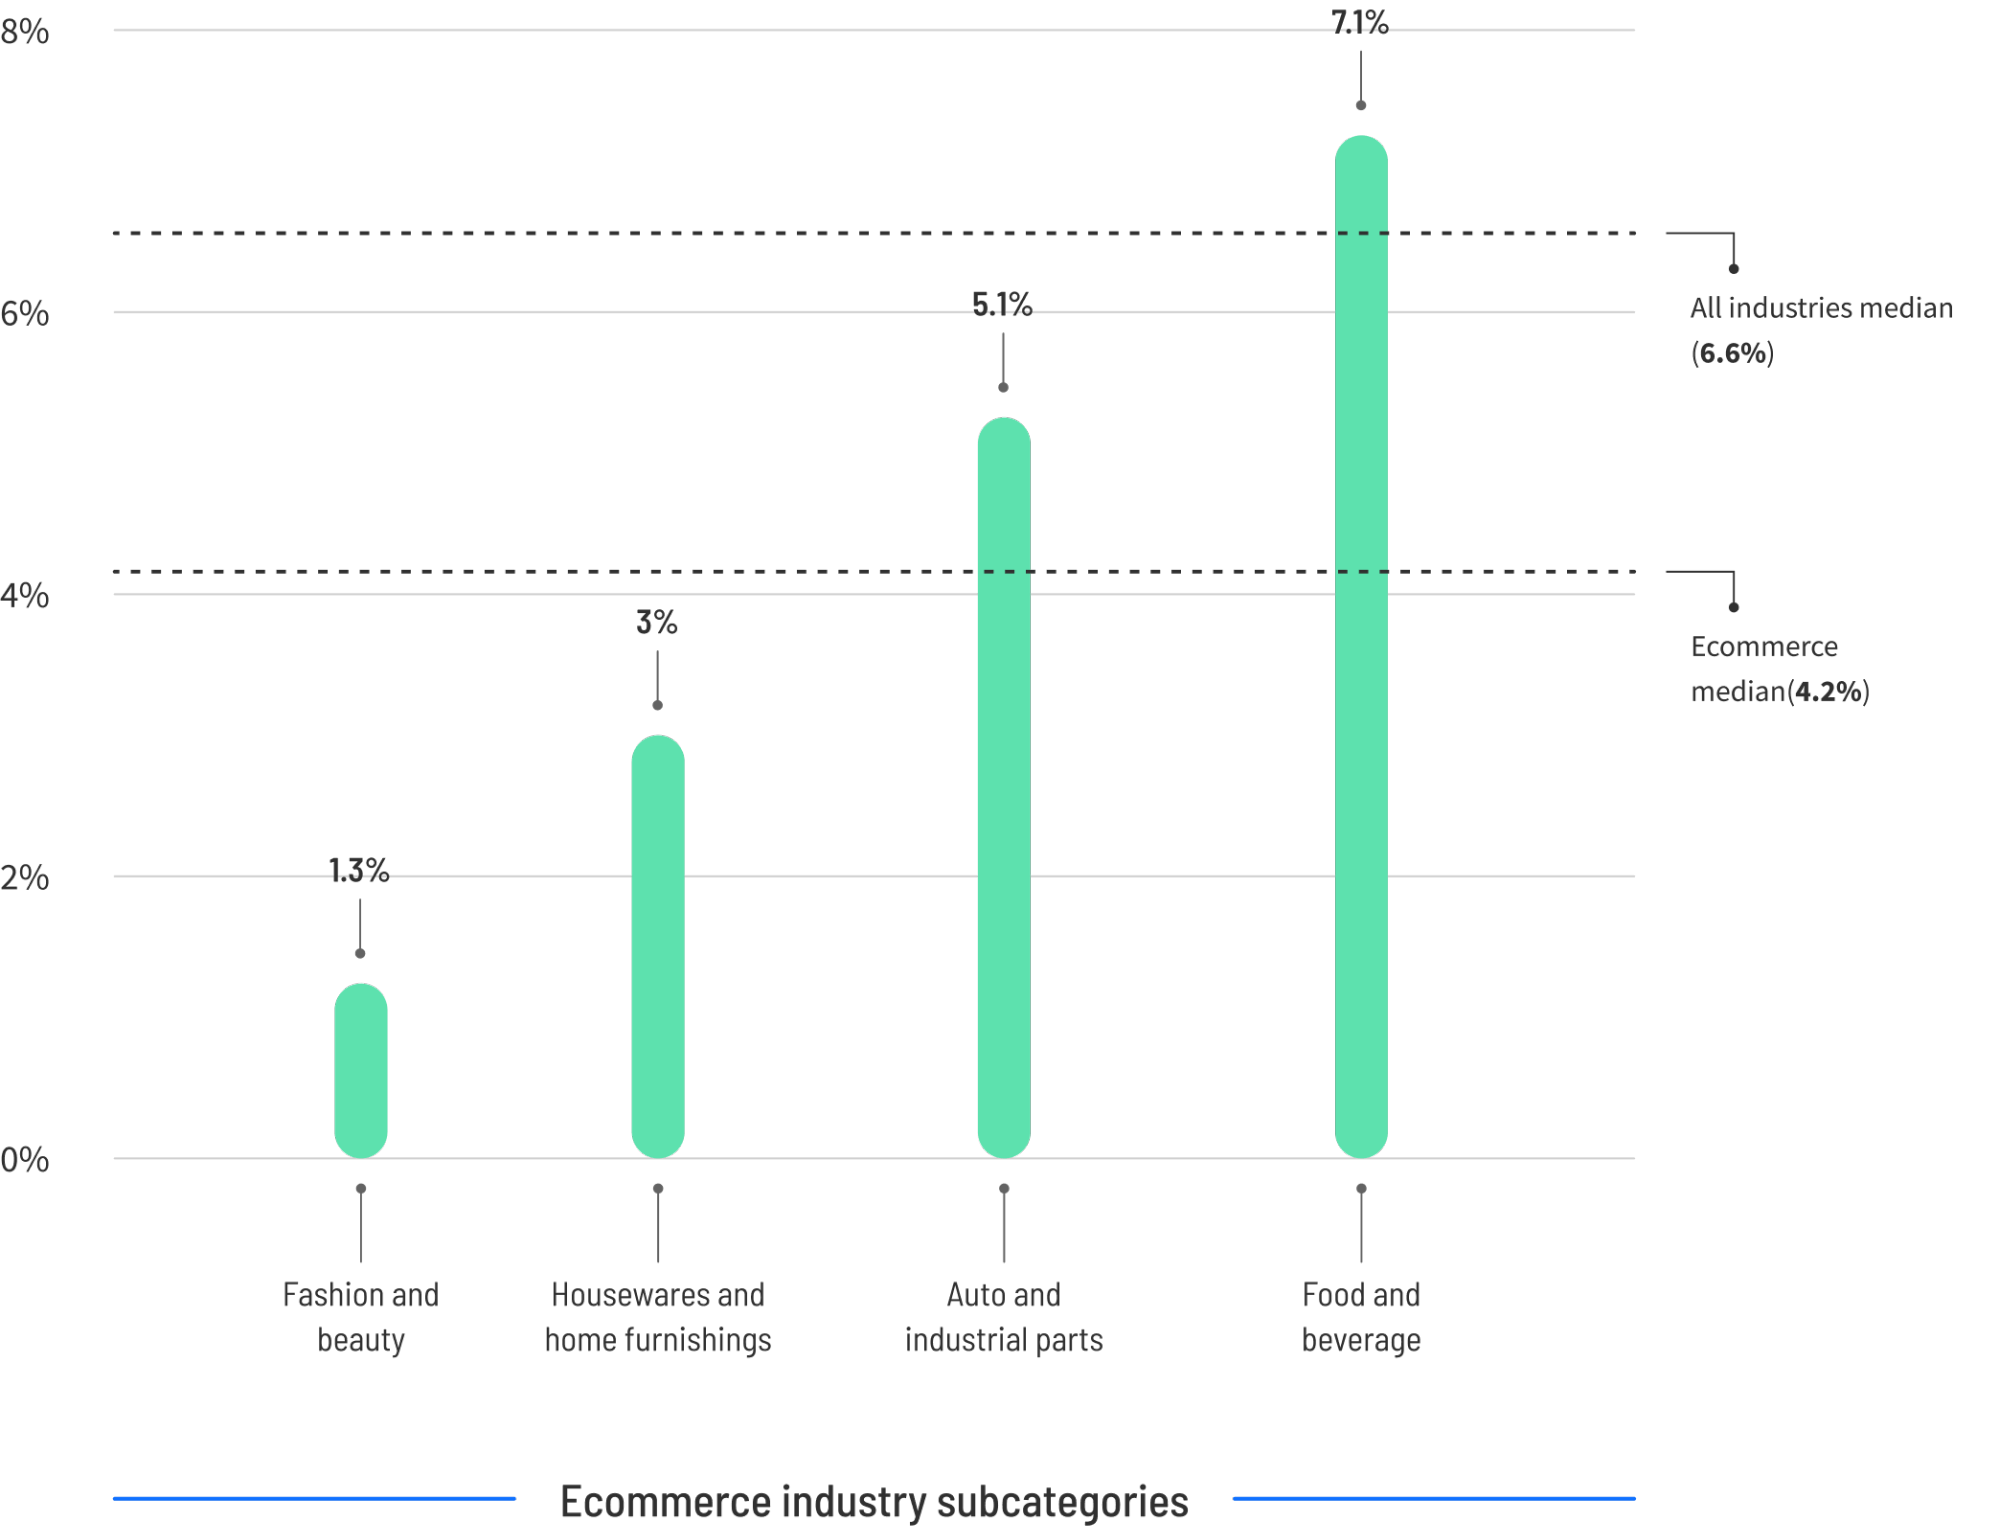
Subcategory variations are massive. Food and beverage pages command a robust 7.1% median, while fashion and beauty pages often hover near a 1.3% median. Context dictates everything.
2. SaaS Conversion Rates
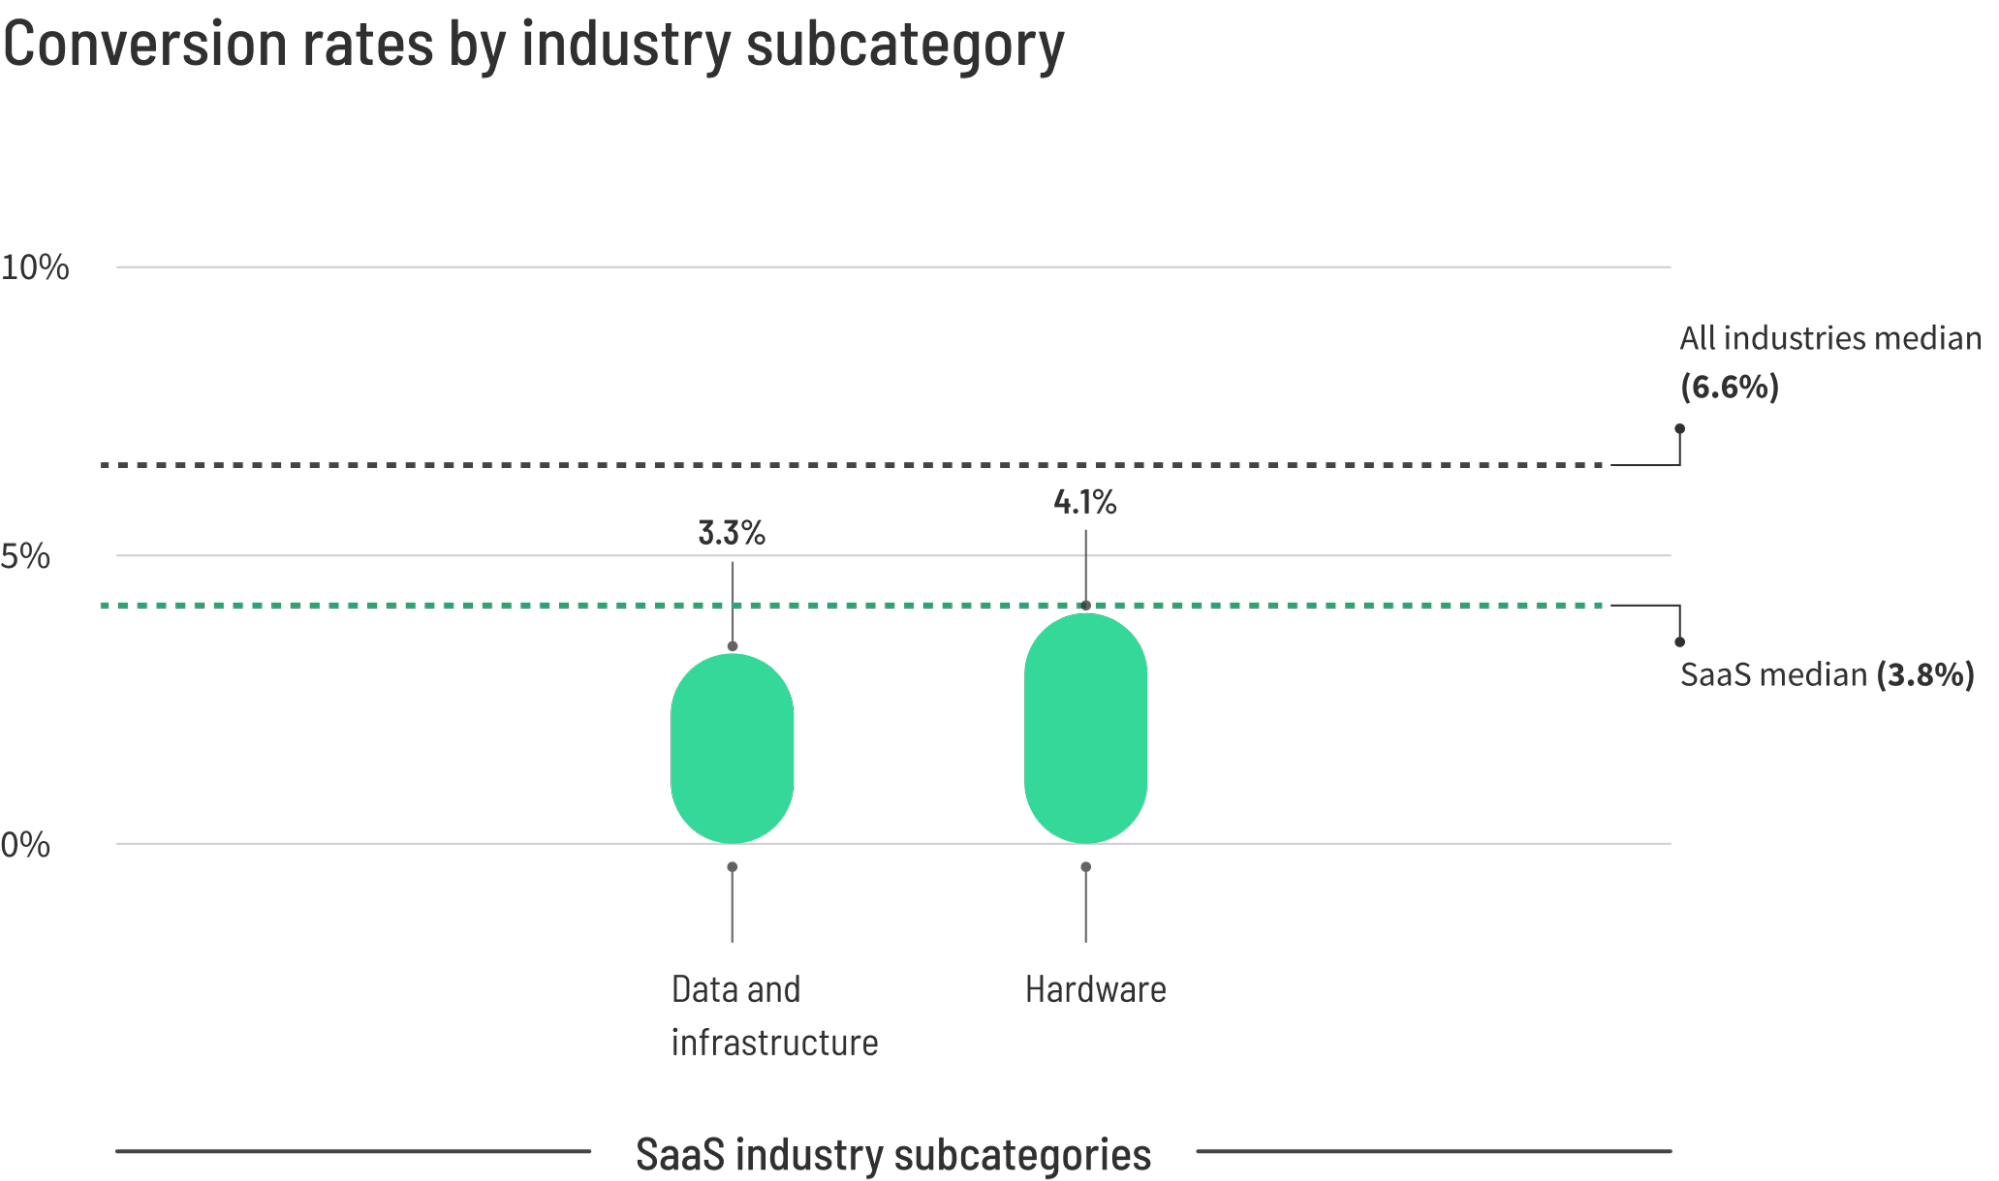
- Median Conversion Rate: 3.8%
- Top-Tier Benchmark (75th Percentile): 11.6% or higher
SaaS landing pages sit below the all-industry median because they promote complex products with elongated sales cycles. Visitors arrive with vastly different intents—some are casually researching, while others are ready to trial software immediately. High-performing SaaS pages bridge this gap by refining messaging around explicit pain points and offering low-friction entry points like credit-card-free trials.
3. Professional Services Conversion Rates
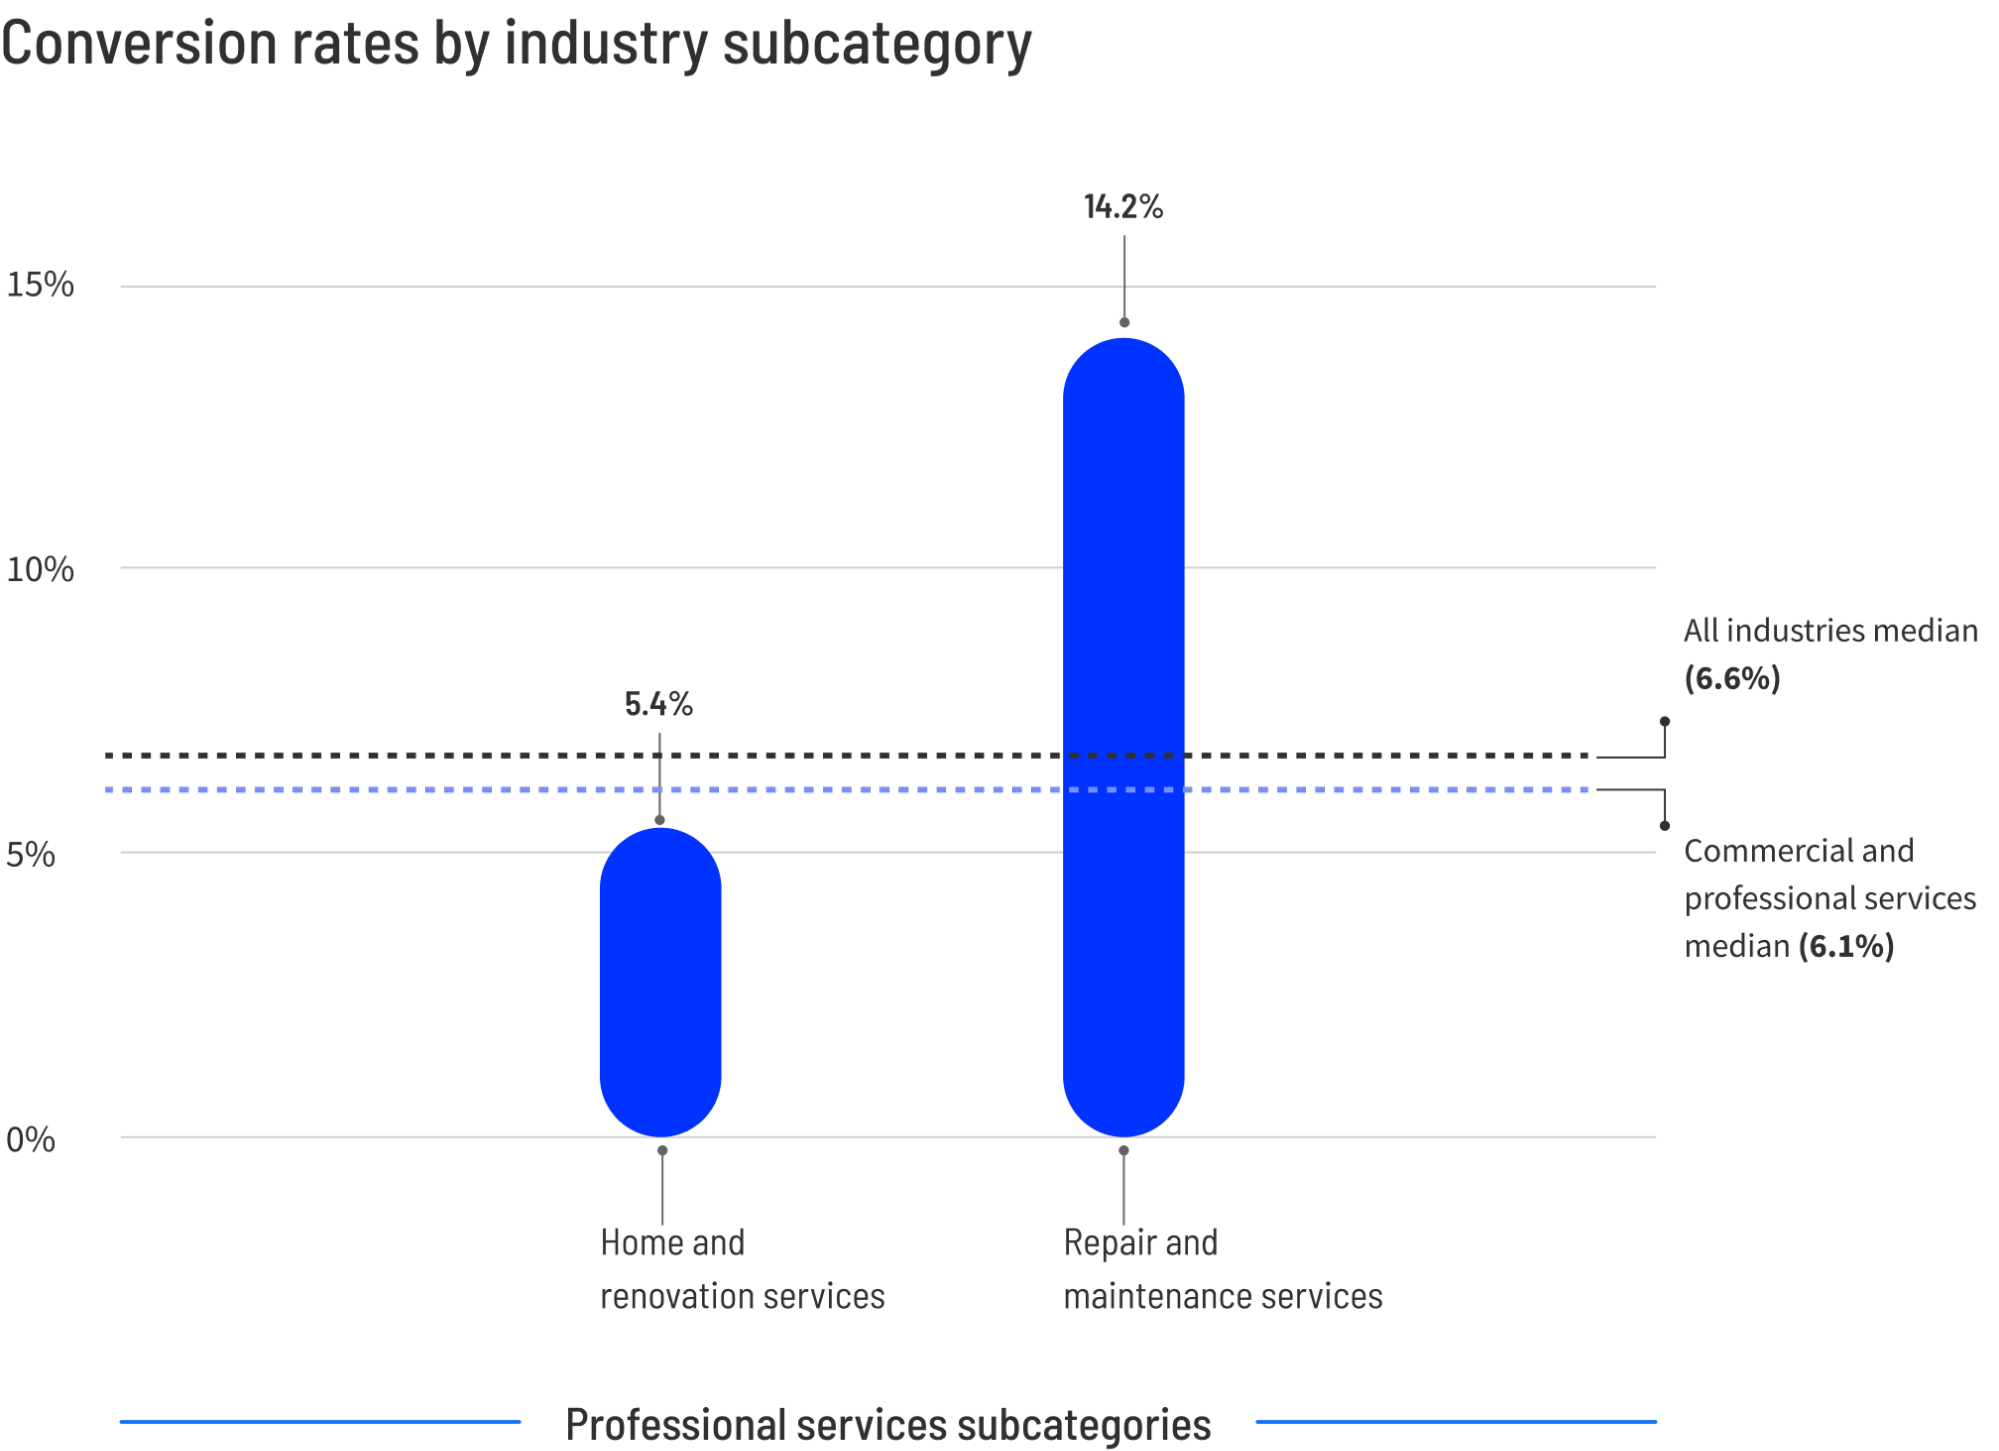
- Median Conversion Rate: 6.1%
- Top-Tier Benchmark (75th Percentile): 14.1% or higher
Encompassing law firms, consultants, and home renovators, professional services rely heavily on trust. Notably, urgency dictates performance: repair and maintenance landing pages convert nearly three times better than kitchen remodeling pages—a leaky pipe demands immediate fixes, whereas a renovation can wait.
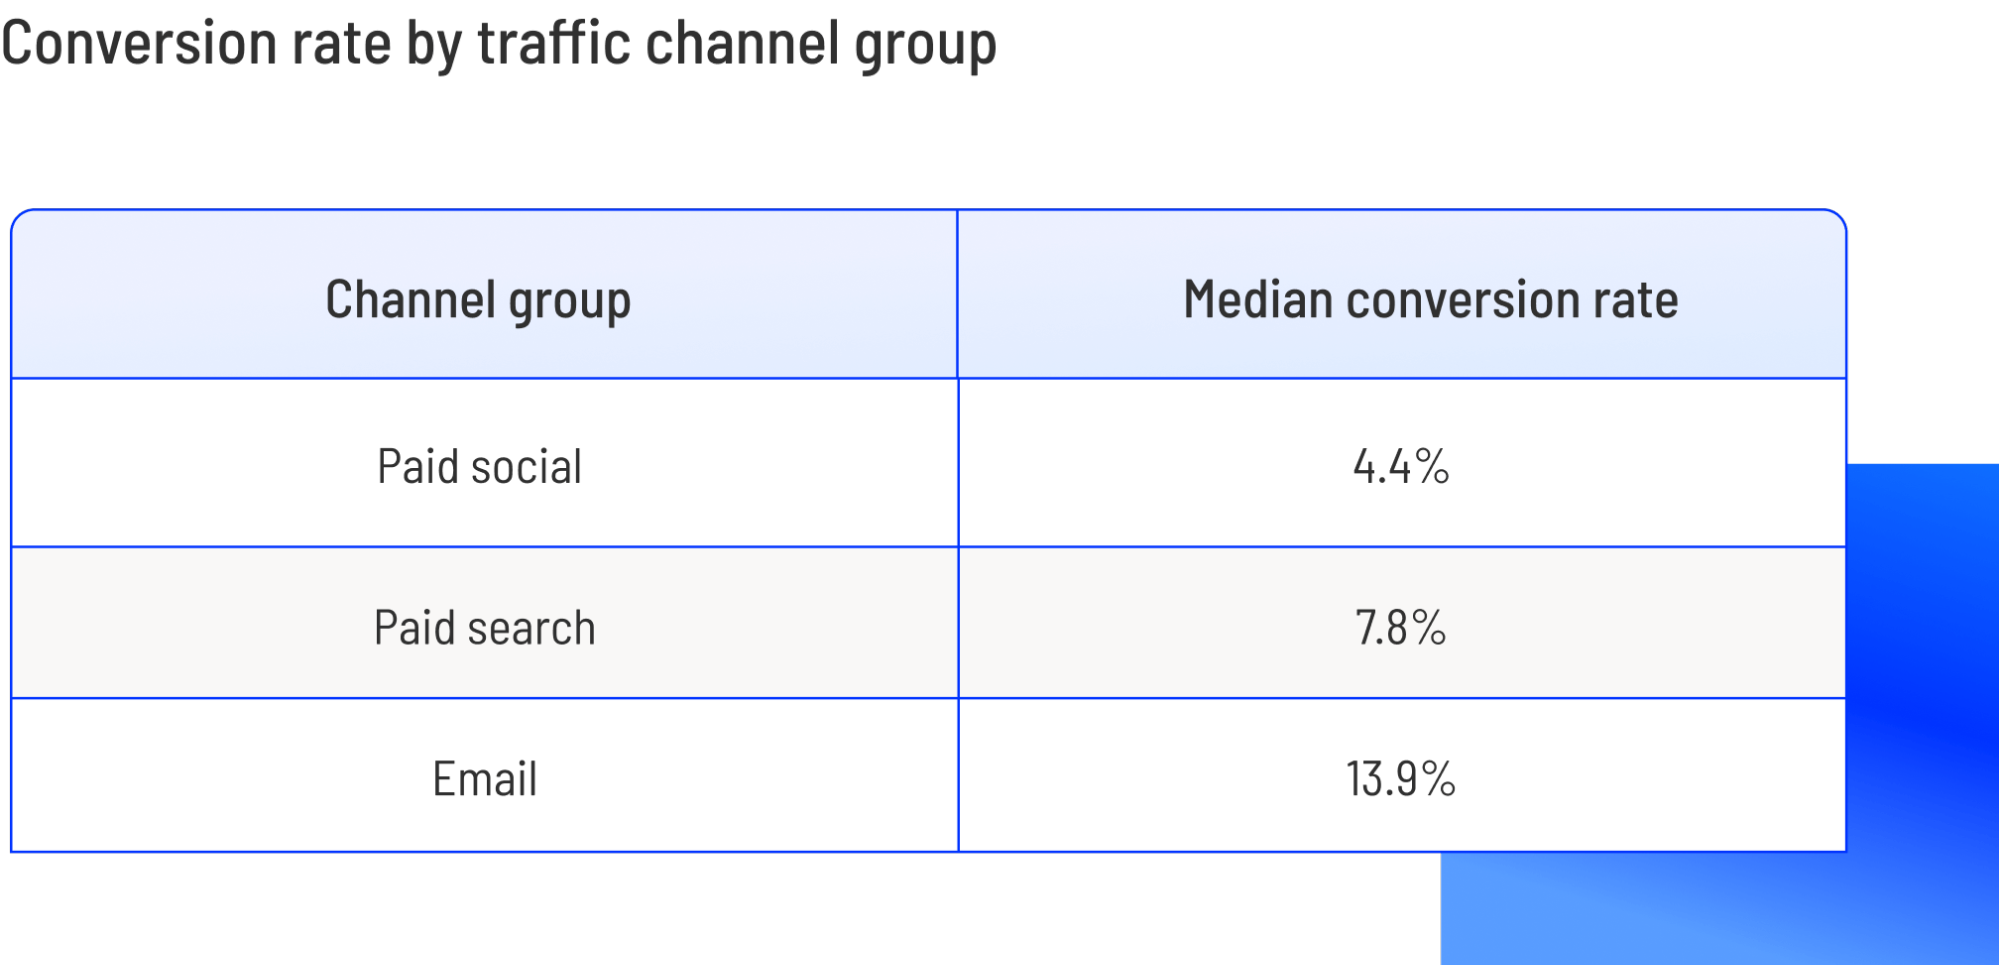
Furthermore, traffic sources matter immensely here. Email traffic converts at nearly 14% for professional services, whereas paid social traffic struggles at just 4.4%.
4. Financial Services Conversion Rates
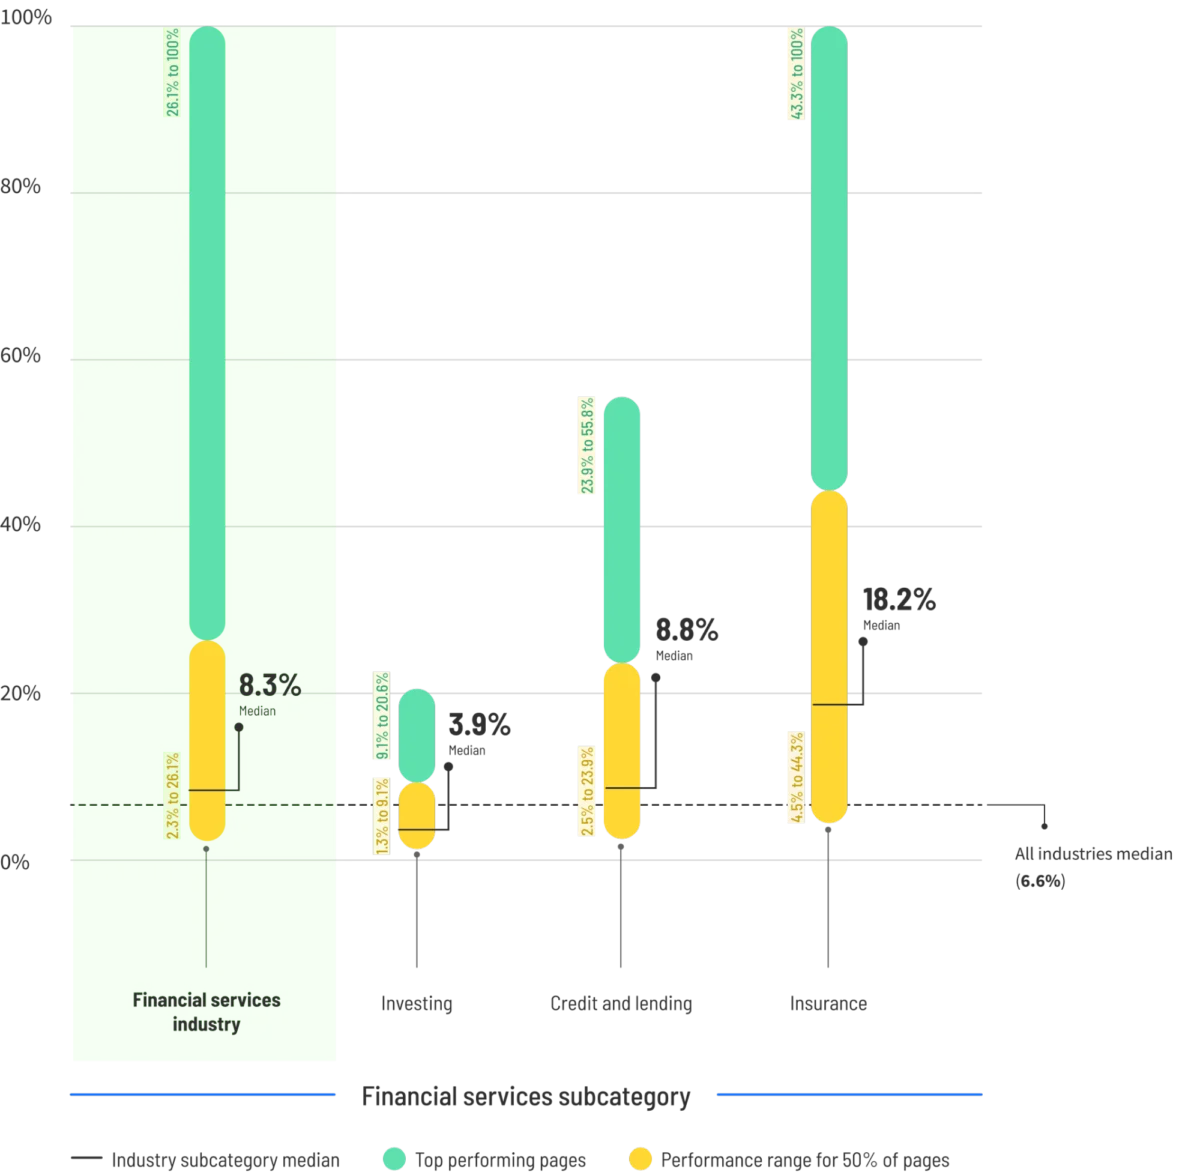
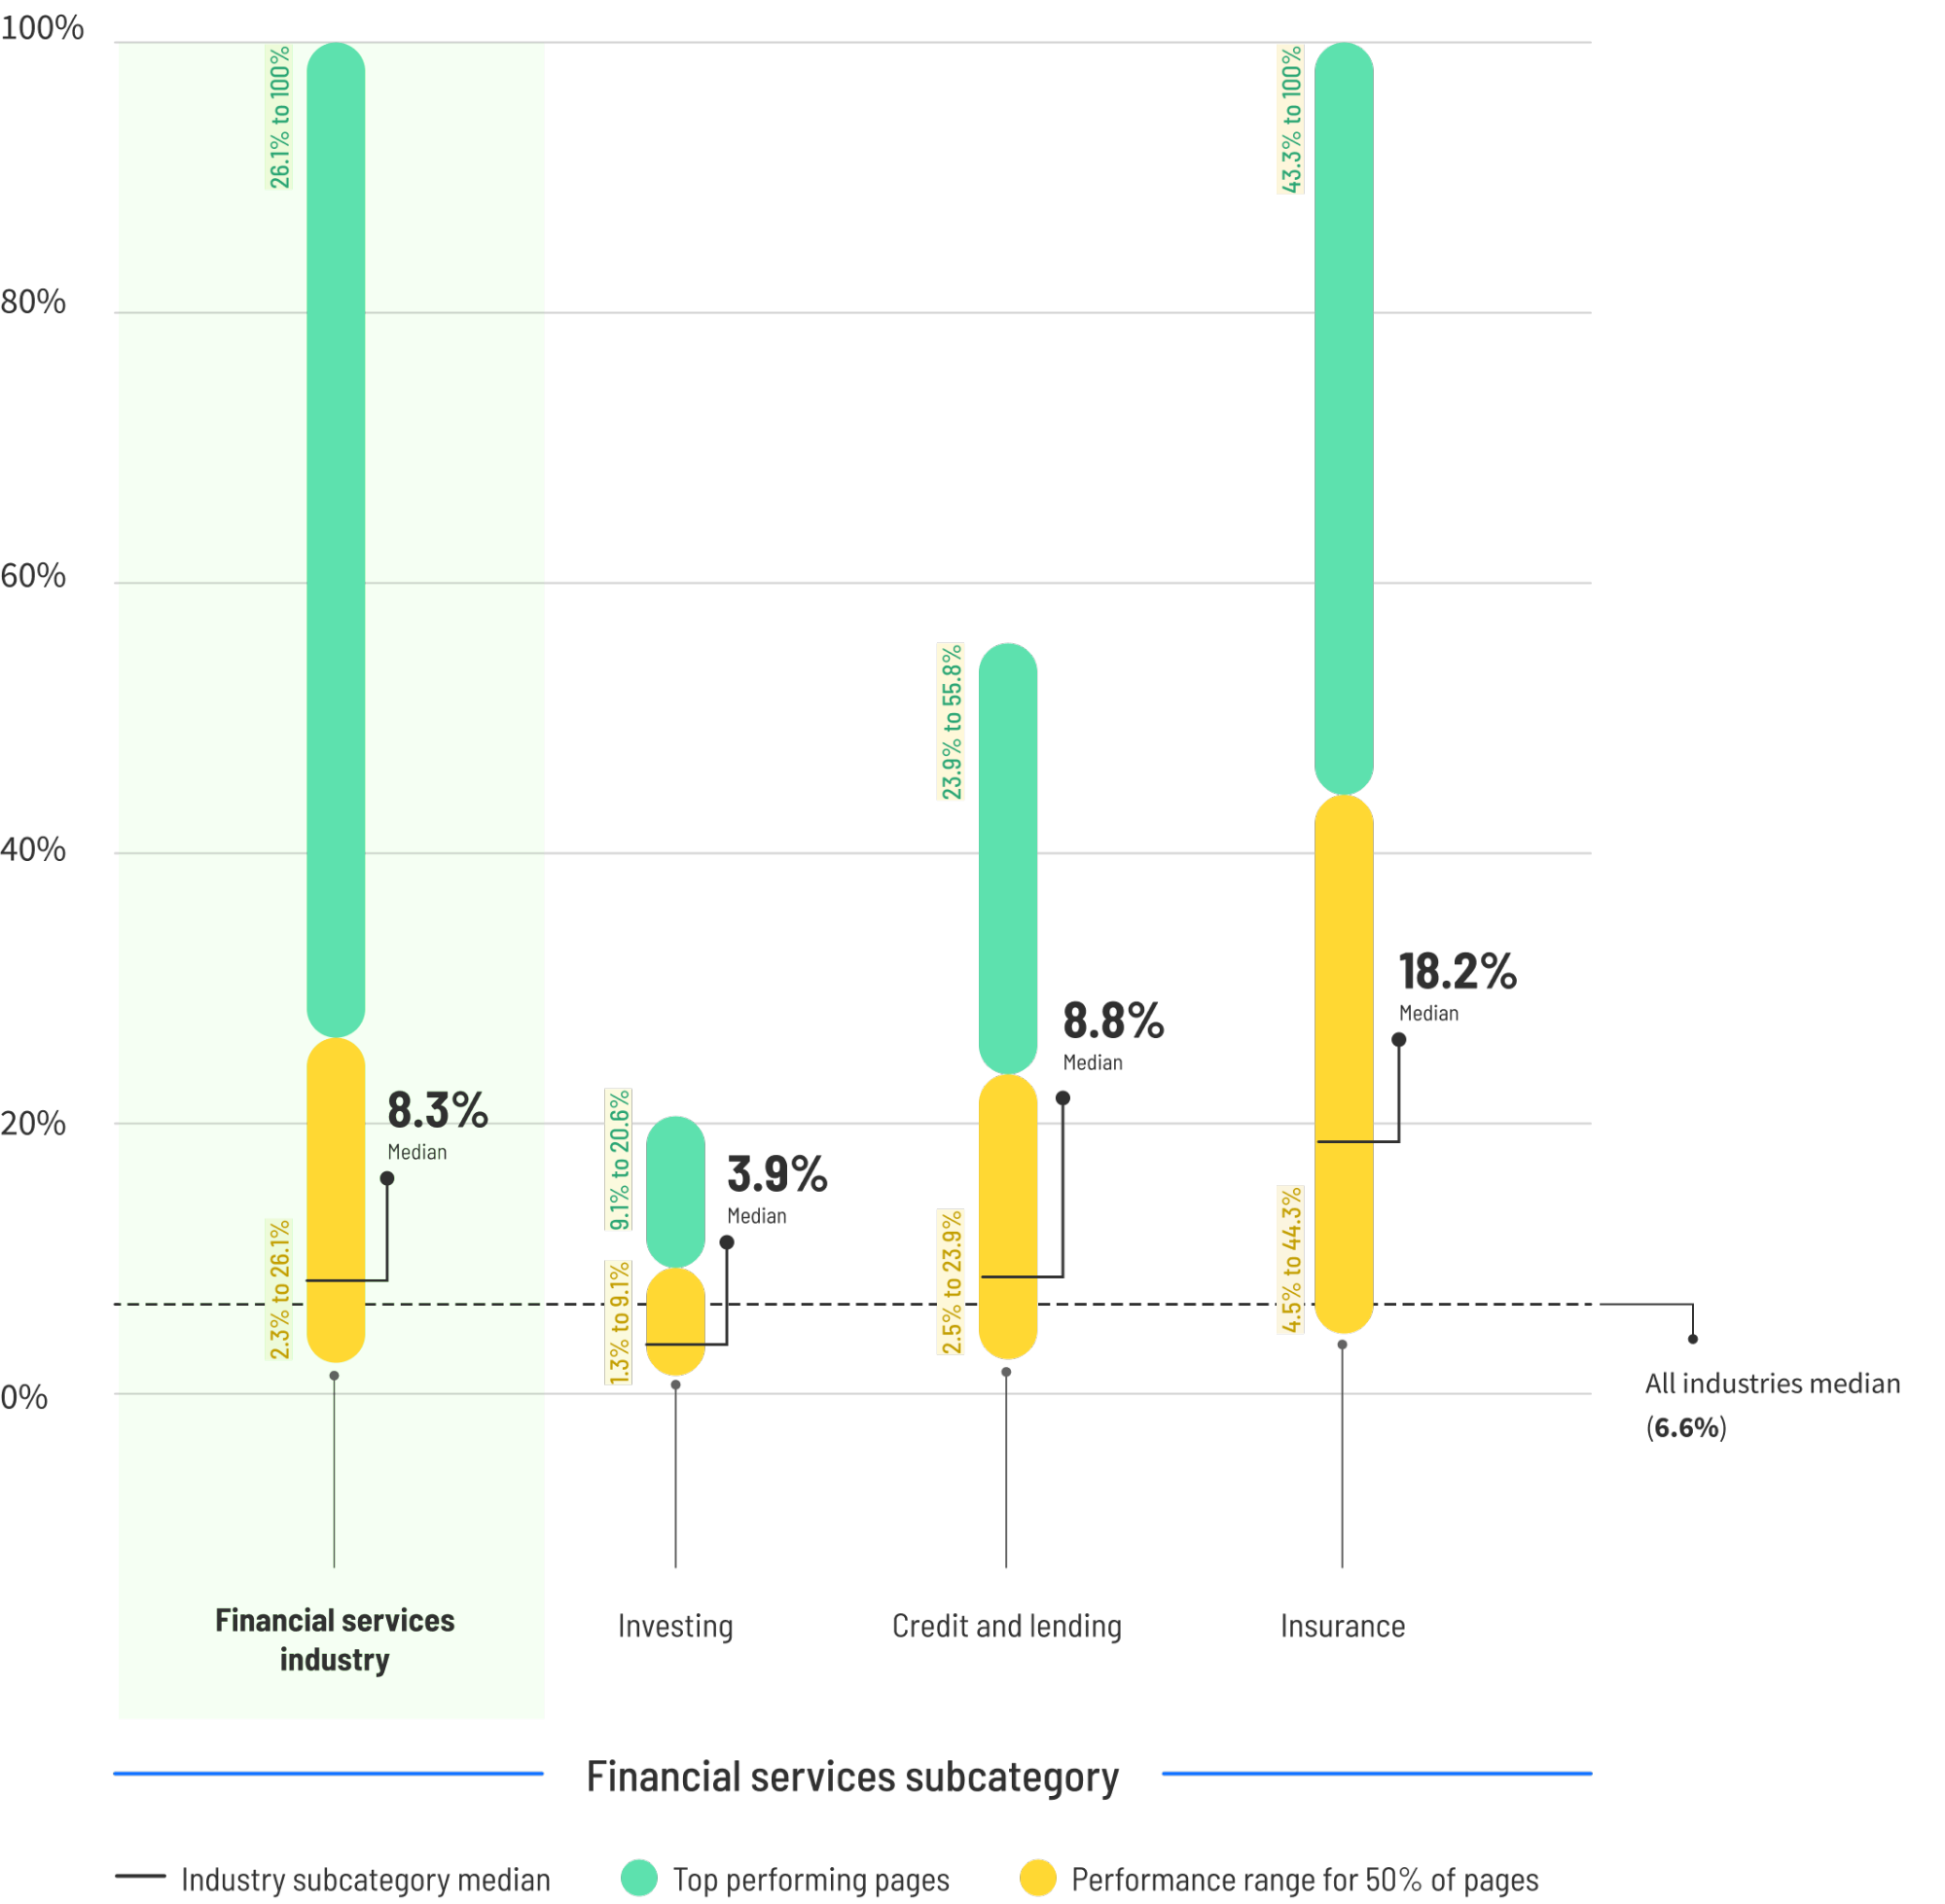
- Median Conversion Rate: 8.3%
- Top-Tier Benchmark (75th Percentile): Varies by subcategory
Finance and insurance pages sit well above the general median due to naturally high user intent. Consumers rarely browse for life insurance or investment portfolios out of mere boredom. Interestingly, mobile traffic converts 27.8% better than desktop in financial services—defying the cross-industry norm and highlighting the importance of mobile-first optimization.
5. Travel, Legal, and Education Verticals
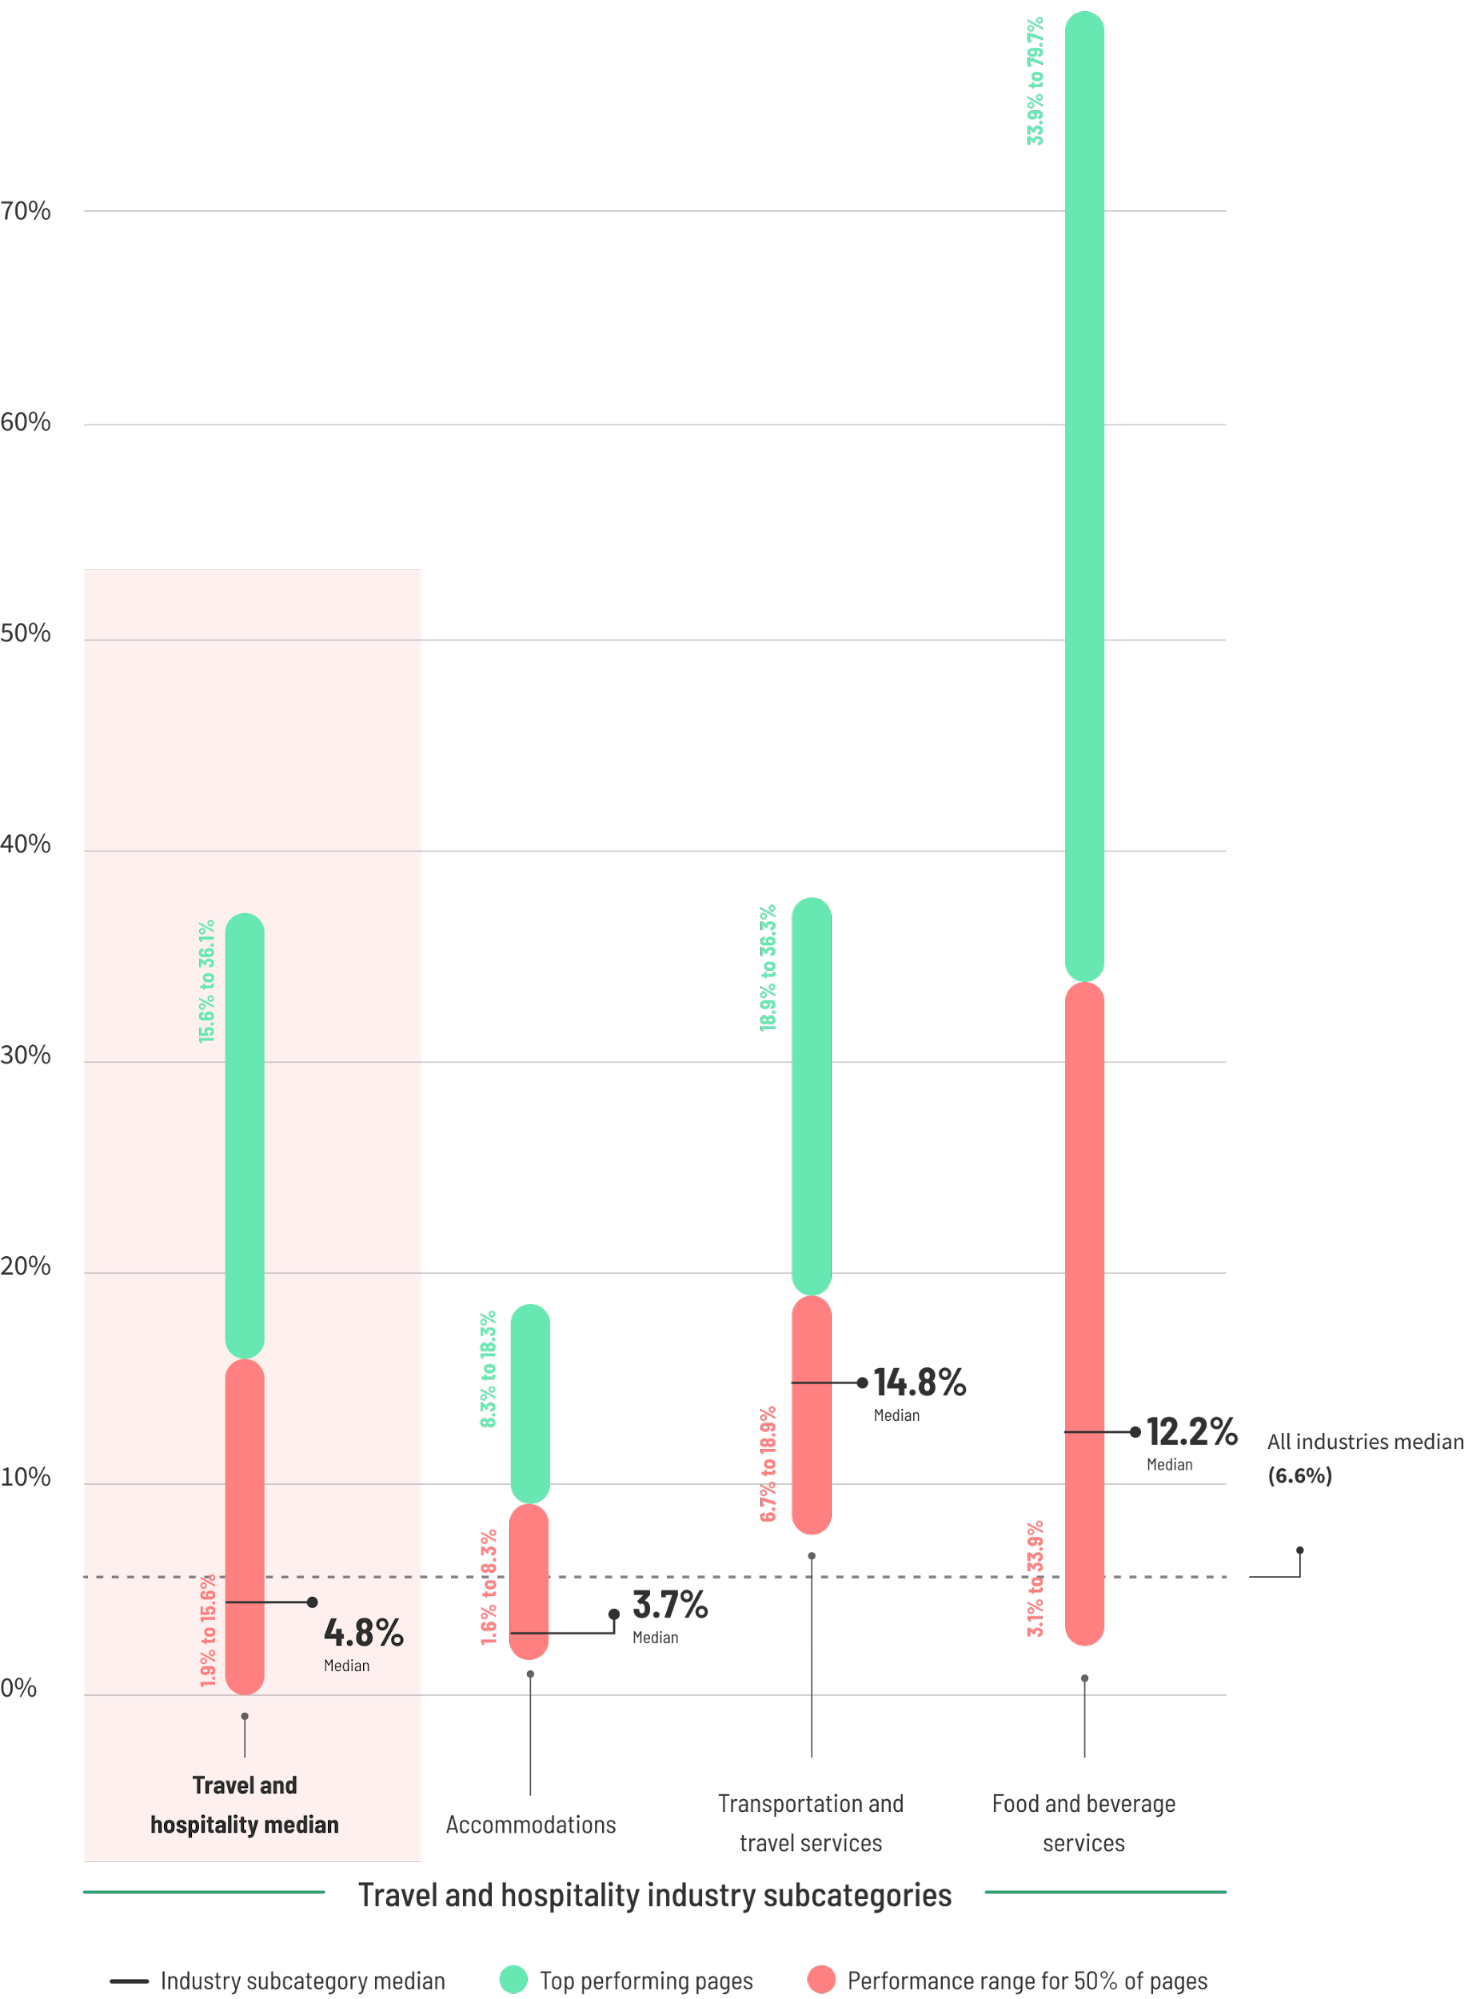
- Travel and Hospitality: Median sits at 4.8%, but top performers hit 15.6% or higher. Transportation bookings vastly outperform hotel bookings due to time-sensitivity.
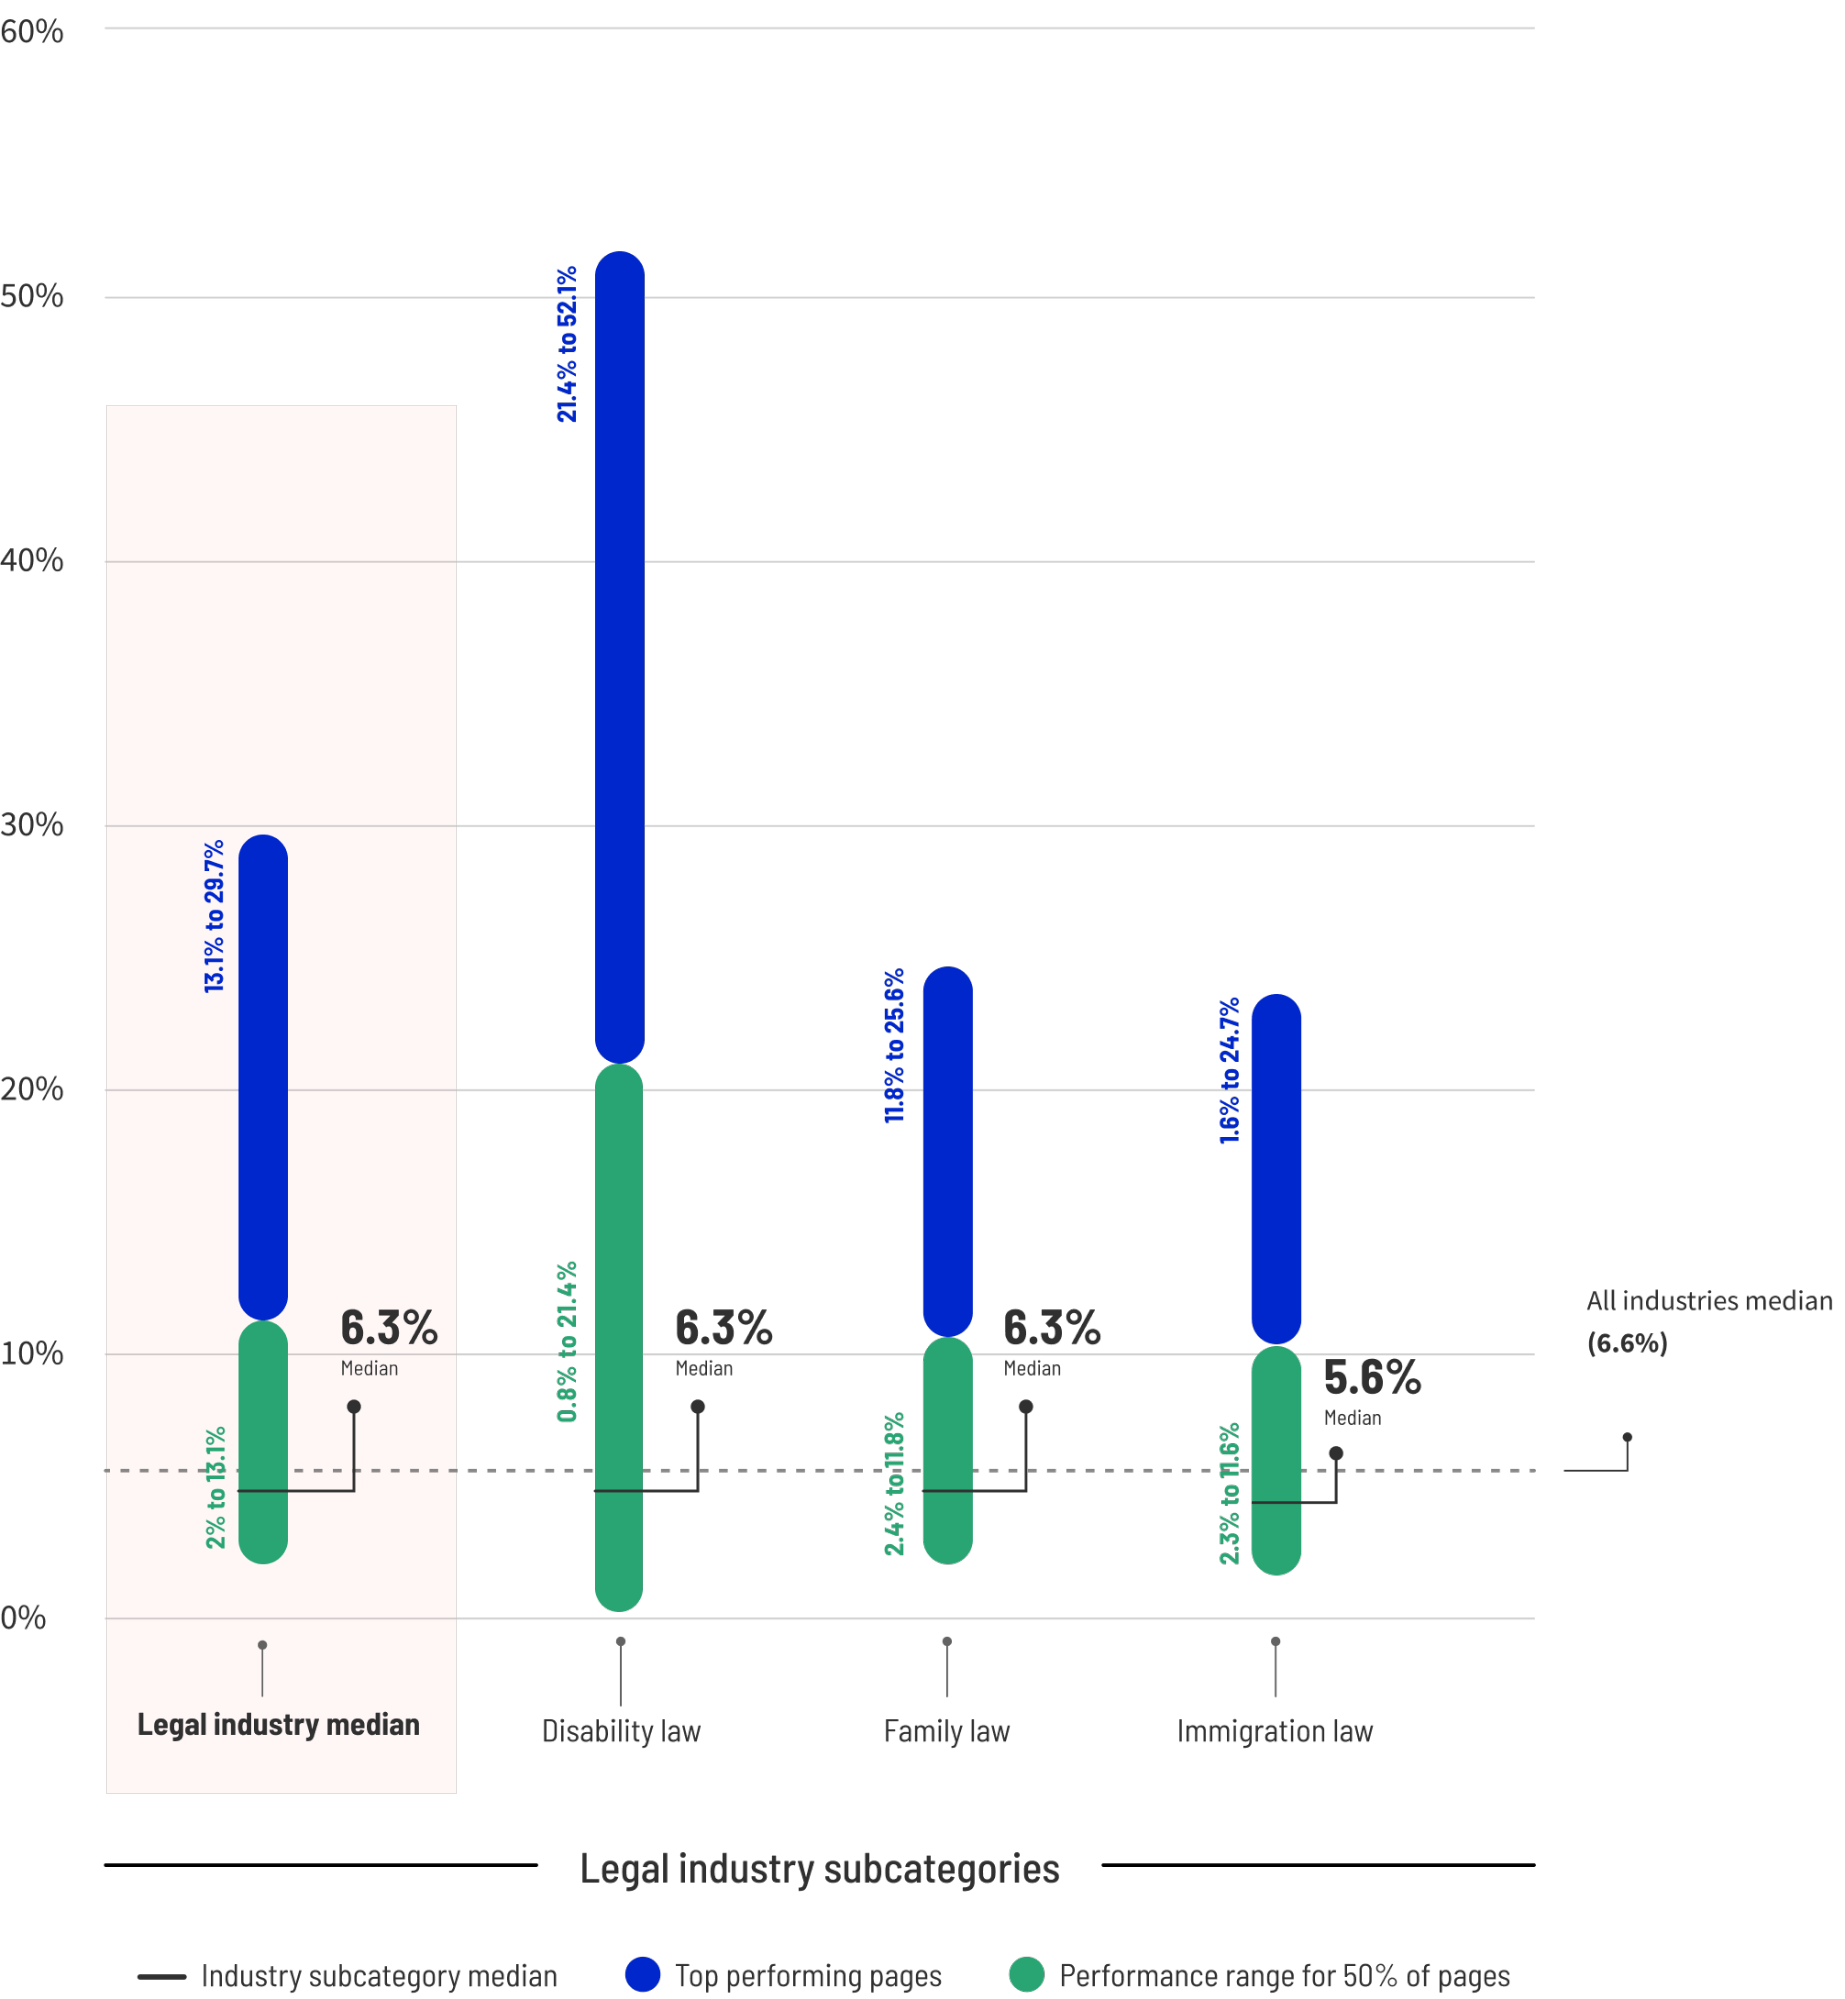
- Legal: Median sits at 6.3%, with top pages clearing 13.1%. Uniquely, legal pages convert better on mobile (21%) than desktop (15.9%), driven by frantic users searching for immediate legal counsel following an accident or emergency.
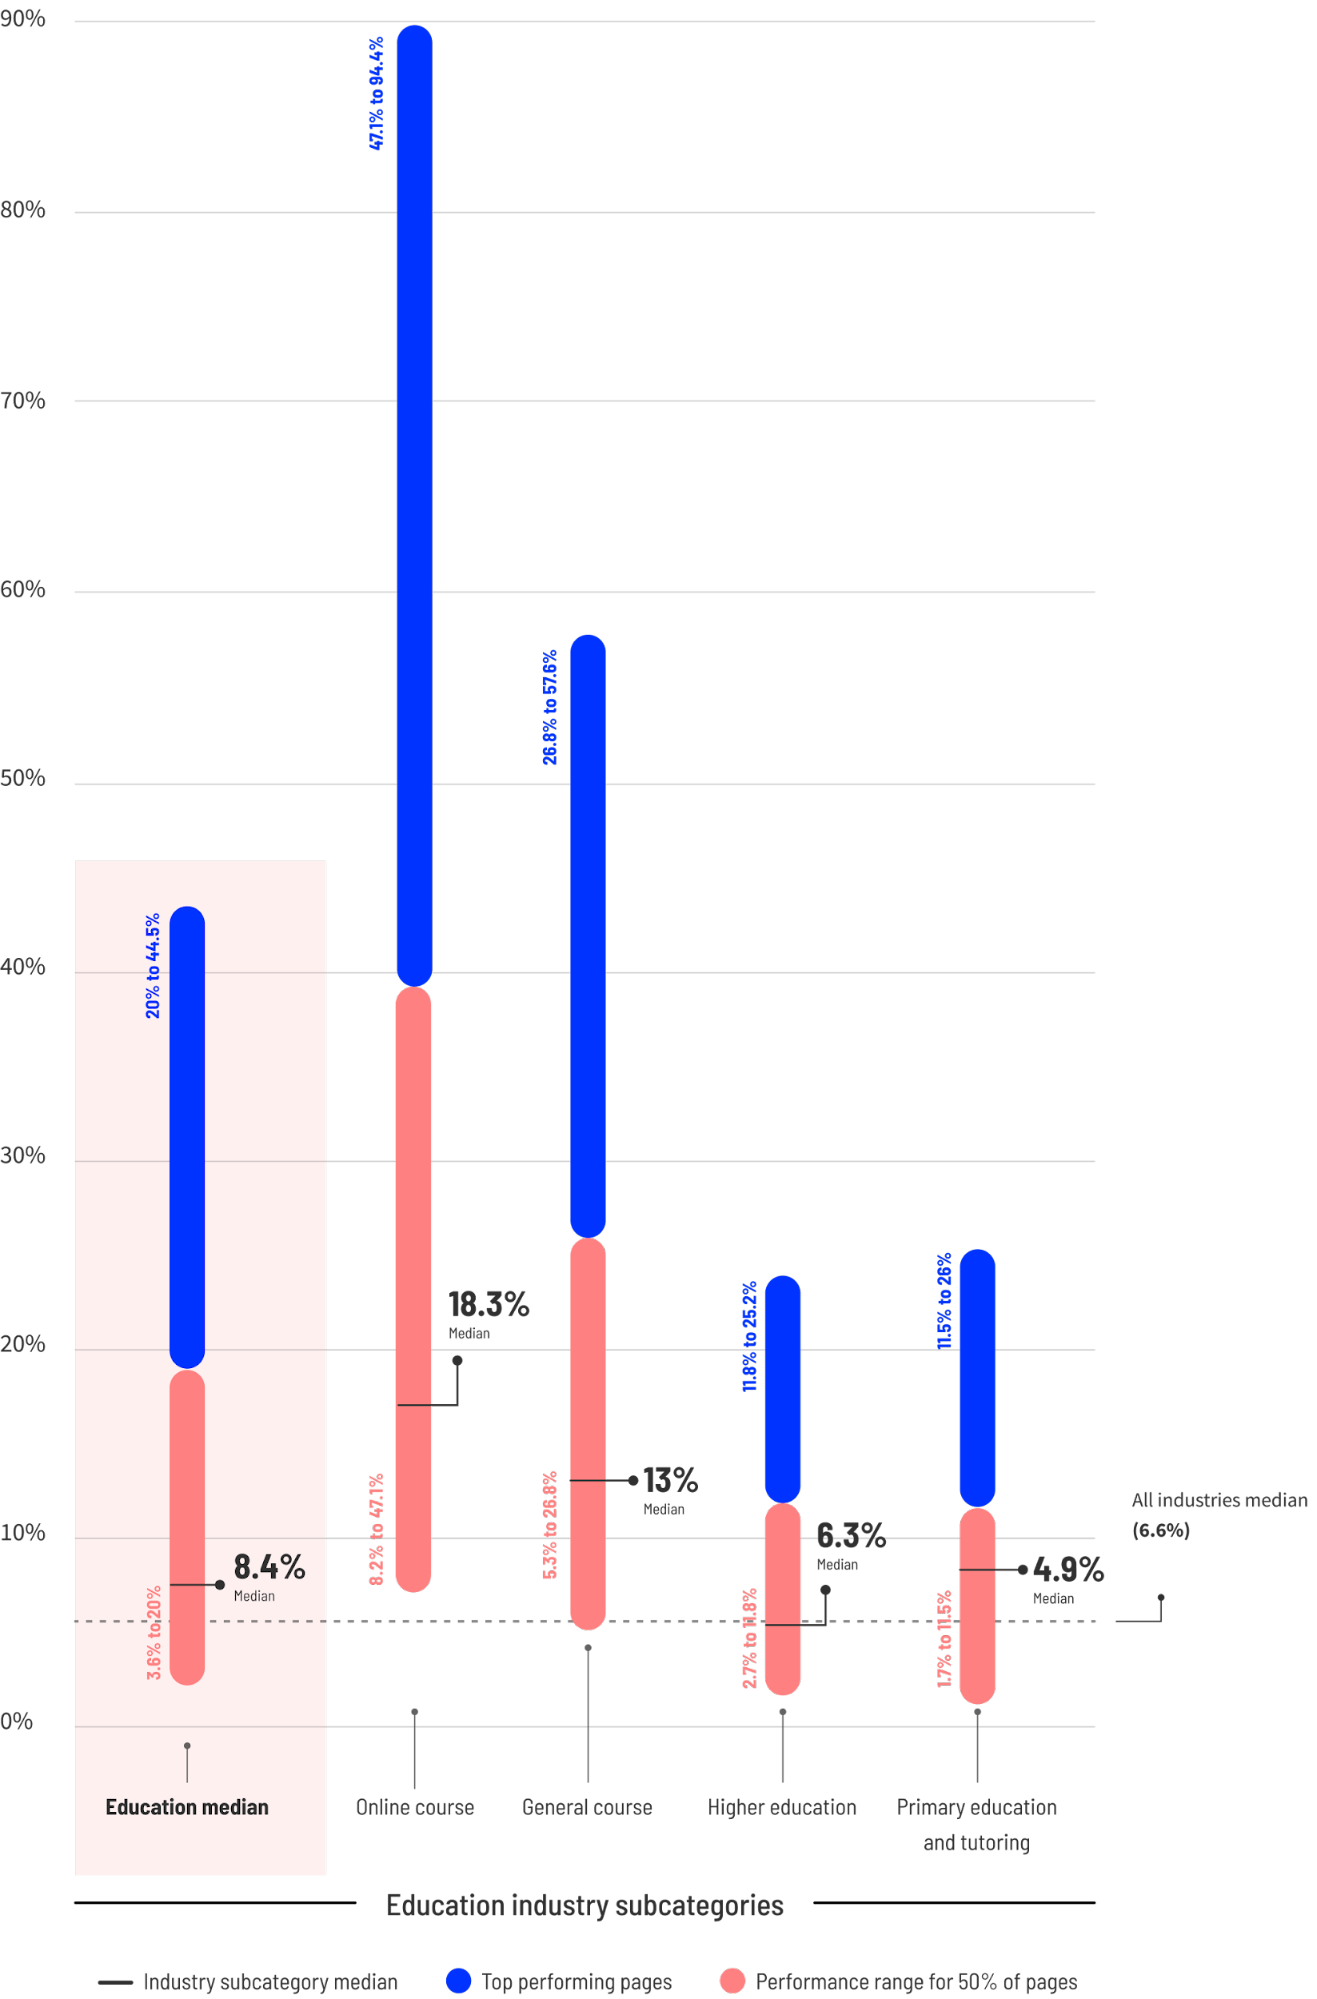
- Education: Online courses are dominating with an 18.3% median conversion rate, largely because they sell immediate transformations (e.g., learning a coding language in 30 days) rather than vague institutional degrees.
Official Responses and Strategic Implications
What separates the average digital marketer from the elite? According to insights drawn from top-performing campaigns, optimization is not a static milestone—it is a continuous operational discipline.
Marketers capturing the highest returns systematically focus on four foundational pillars:
- Clarity of Messaging: Simplicity wins. Pages written at a 5th-to-7th grade reading level convert at 11.1%—outperforming 8th-to-9th grade content by 56% and doubling the conversion rate of overly dense, "professional" corporate jargon.
- Frictionless Mobile Experiences: While mobile devices account for 83% of landing page visits, they historically underperform on desktop conversions unless explicitly streamlined for fast, thumb-friendly navigation.
- Strategic Social Proof: Positioning testimonials, real review counts, and client trust logos directly adjacent to conversion forms rather than burying them at the footer dramatically reduces visitor hesitation.
- Intent Alignment: Matching the traffic channel to the offer—such as leveraging email lists for high-intent professional services or deploying paid search for high-urgency legal needs—sustains long-term growth.
Conclusion: The Path Forward
Benchmarks tell organizations where they stand in the competitive landscape, but closing the gap between average and excellent requires rigorous execution. The businesses capturing outsized returns aren’t wielding secret formulas; they are systematically testing copy, speeding up page-load times, stripping out extraneous navigation links, and aligning every pixel with visitor intent.
For brands looking to scale their digital infrastructure without expanding engineering overhead, platforms equipped with automated A/B testing and AI-driven traffic routing (such as Unbounce’s Smart Traffic) are transforming how modern marketing teams approach conversion optimization. The journey never truly ends—it only scales.