








In the modern digital landscape, data saturation is rarely the primary challenge for product and marketing teams. Most organizations are swimming in metrics, dashboards, and event-tracking logs. The real, persistent problem—the "missing link" of digital optimization—is the agonizingly slow journey from identifying a drop-off in a dashboard to understanding the root cause, and finally implementing a fix.
This week, Wingify, a leader in digital experience optimization, announced the launch of Journey Analytics, a new quantitative analytics layer designed to unify the fragmented workflow of data analysis. By integrating high-level metrics directly with granular, behavioral insights, Wingify aims to eliminate the friction that causes teams to lose critical context when pivoting from insight to action.
The Crisis of Context: Why Current Analytics Stalls Innovation
For years, the industry standard for product optimization has been a disjointed, multi-tool ecosystem. A product manager might identify a conversion drop in a specialized analytics tool, only to switch to a separate session-recording platform to investigate "why" that drop occurred. By the time they translate those findings into a testable hypothesis, the original context—the nuance of the user’s experience—often fades or becomes distorted.
This "context loss" is a silent killer of conversion rates. When teams lack a single platform to bridge the gap between "what" is happening (the quantitative) and "why" it is happening (the behavioral), they suffer from decision paralysis. The newly launched Journey Analytics layer is Wingify’s answer to this fragmentation, built specifically to keep the quantitative data and the qualitative, visual evidence in the same environment.
Chronology of the Development: From Silos to Synergy
The development of Journey Analytics marks a significant shift in Wingify’s platform philosophy. For over a decade, the company has been synonymous with A/B testing and personalization. However, as the digital experience market matured, Wingify’s internal research highlighted a critical pain point: customers were spending more time "connecting the dots" between tools than actually optimizing their user journeys.
- Phase 1: Identifying the Friction: User research revealed that teams were losing up to 40% of their velocity due to tool-switching and manual data integration.
- Phase 2: Architectural Integration: Rather than building a separate, standalone analytics product, Wingify engineers focused on creating an "analytics layer" that sits natively within their existing ecosystem. This ensured that no engineering effort was required to tag events or configure complex tracking from scratch.
- Phase 3: The AI Integration (Wingz): Recognizing that raw data can be overwhelming, the development team integrated their agentic AI layer, "Wingz," to act as an interpretive bridge, allowing users to converse with their data rather than just viewing charts.
- Phase 4: Launch and Ecosystem Expansion: With the October 2026 launch, Journey Analytics is now positioned as the central nervous system of the Wingify suite, connecting insights directly to the testing and personalization engines.
Deep Dive: Key Features of the Journey Analytics Suite
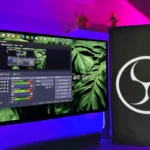
The power of Journey Analytics lies in its ability to translate raw events into actionable business intelligence. The platform offers several core modules that replace the need for fragmented, third-party analytics software.

1. Metric Reports: Real-Time Performance Monitoring
Metric reports provide a longitudinal view of unique users, event frequency, and conversion events. Unlike static dashboards, these reports allow teams to account for seasonality, ensuring that a dip in traffic or conversion isn’t misinterpreted as a product failure when it is, in fact, a cyclical trend.
2. Funnel Analysis: Identifying the "Leak"
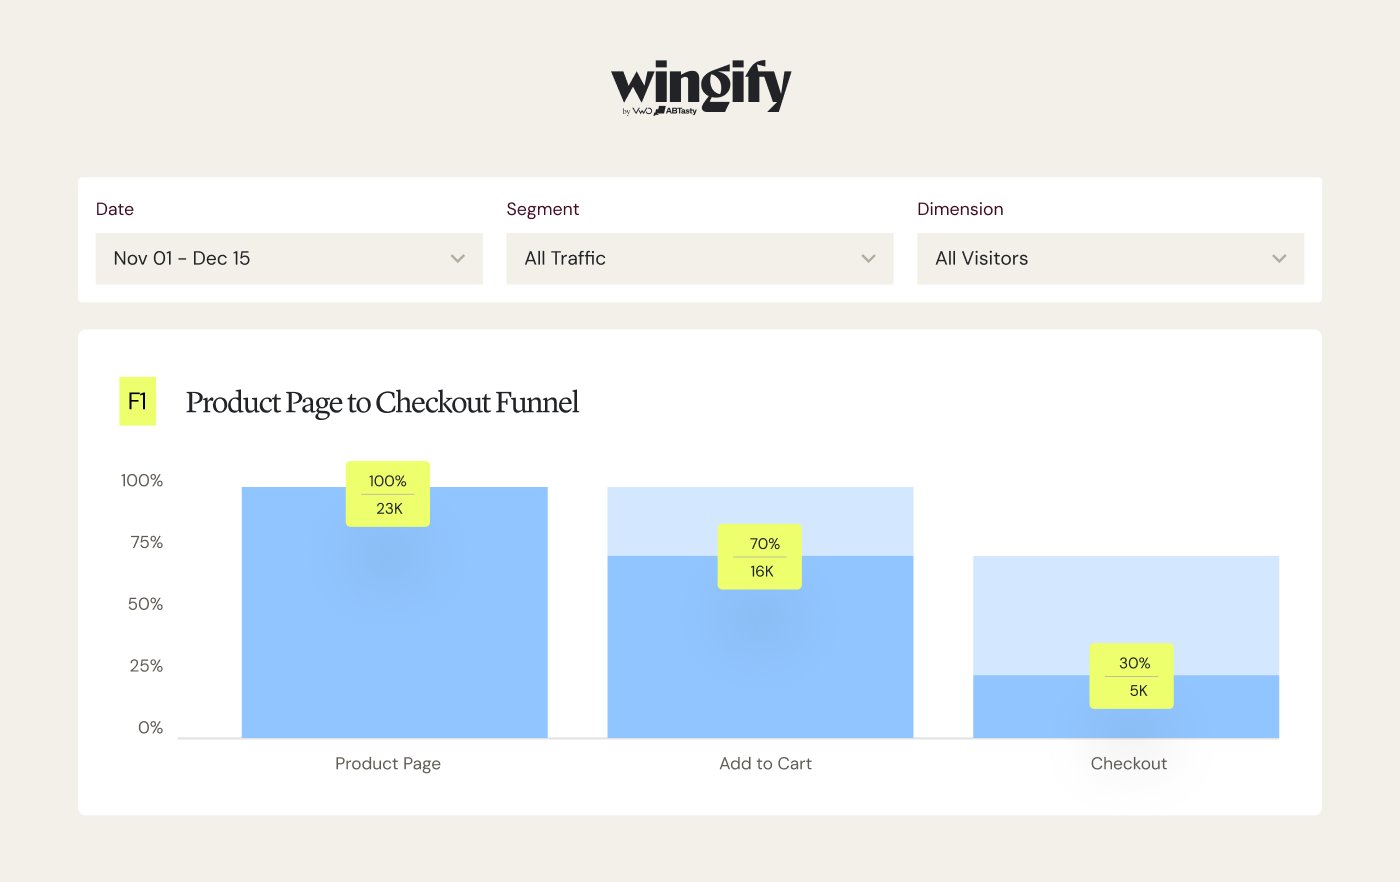
The funnel reporting module visualizes the user journey as a step-by-step path. It highlights precisely where a user drops off, turning vague "high bounce rates" into specific, targetable problems. By visualizing the conversion path, teams can pinpoint which stage—be it a checkout form or a navigation menu—is causing the highest attrition.
3. User Flows: Uncovering the Unknown
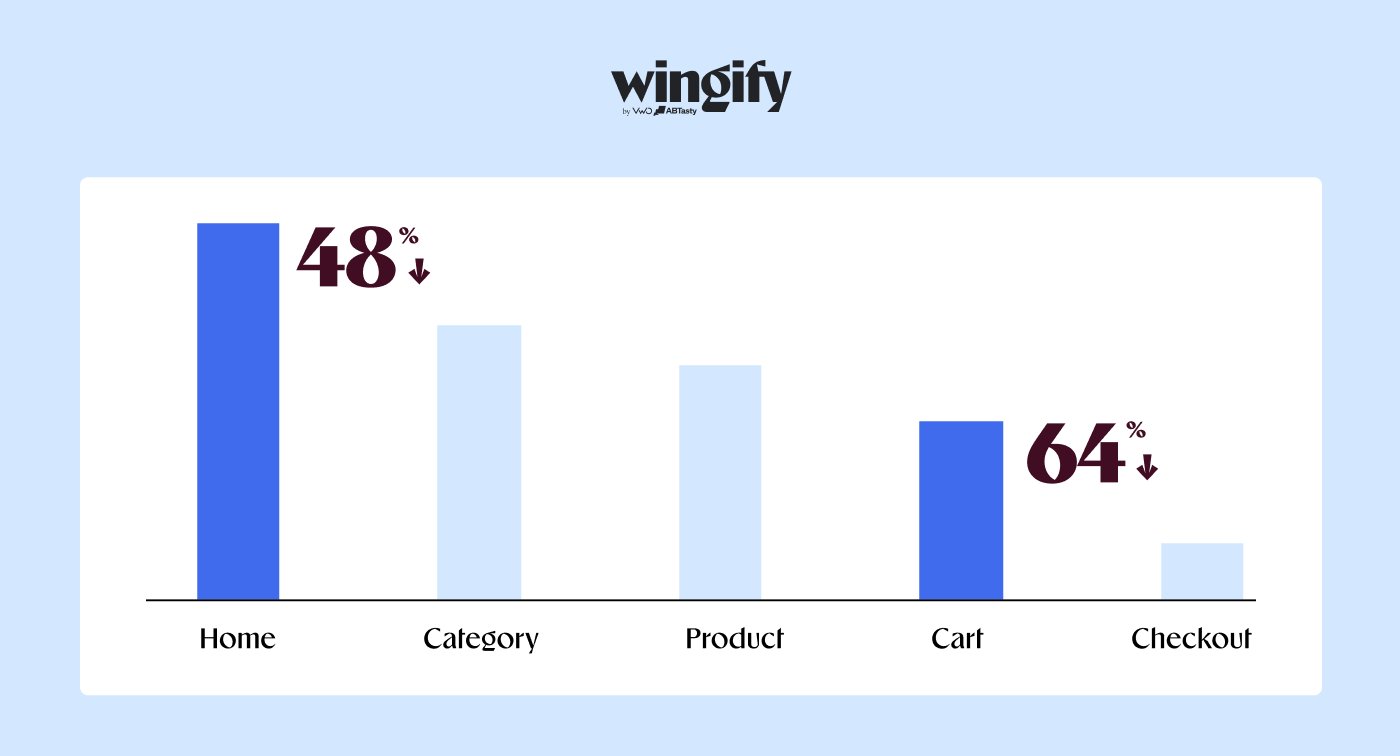
While funnels track the path you expect users to take, User Flows reveal the paths they actually take. This feature is instrumental for identifying "shadow paths"—unintended journeys that might be diverting users away from conversion goals. It allows teams to visualize user behavior before and after key events, providing a holistic view of site architecture usage.
4. Board Centralization
To keep stakeholders aligned, the platform features customizable "Boards." These act as a unified source of truth, bringing together metrics, funnels, and user journeys into a single, shareable view. This eliminates the need for manual reporting and ensures that the entire team is looking at the same data in real-time.
The Behavioral Link: From Data to Session Recordings
Perhaps the most significant differentiator of Journey Analytics is its "one-click" connectivity. From any quantitative report—whether it is a funnel step or a metric deviation—a user can instantly access the session recordings and heatmaps associated with that specific segment of traffic.
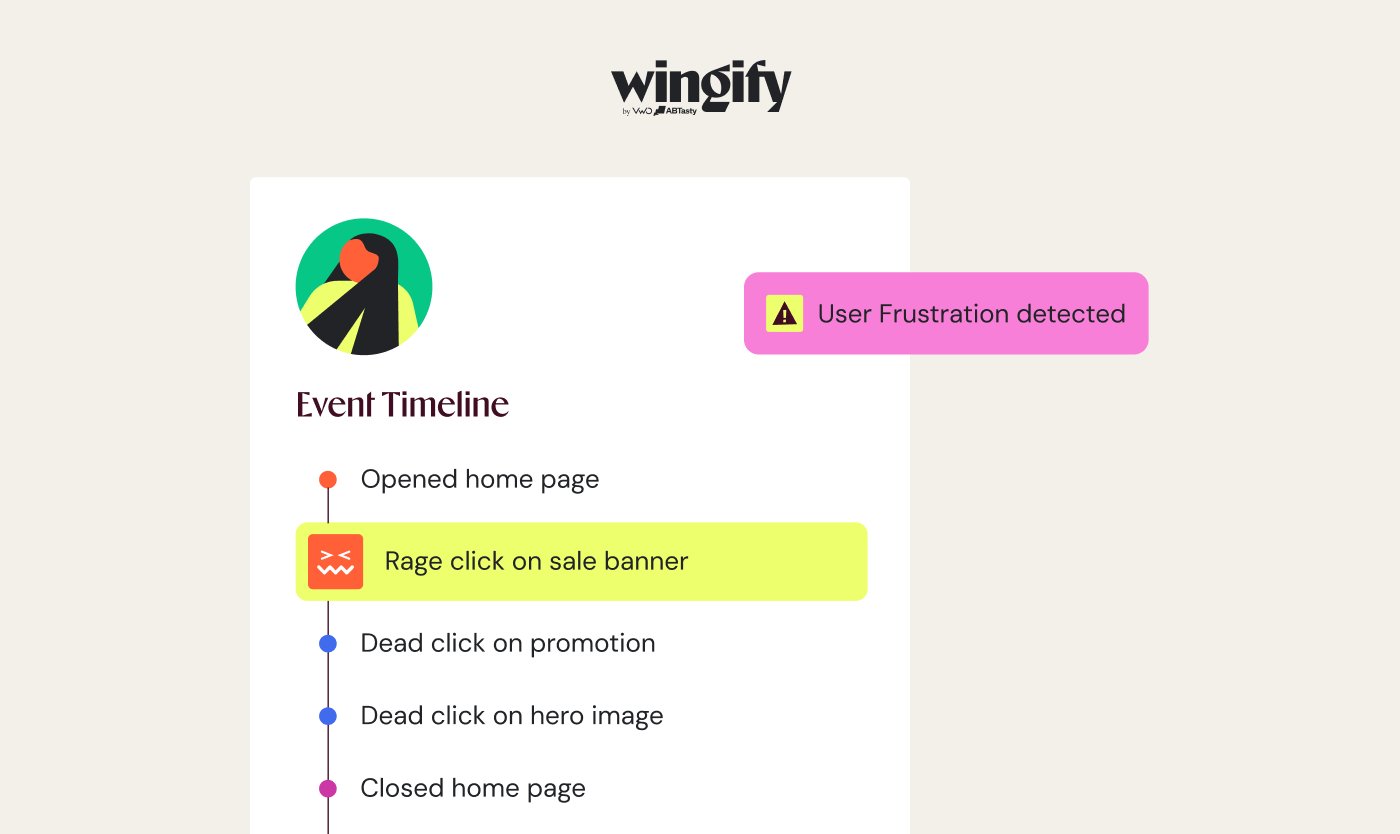
This eliminates the "guessing game" of analytics. Instead of inferring why a user failed to complete a purchase, a marketer can watch the exact session where that user encountered friction. By seeing the mouse movements, the hesitation, and the specific UI elements that caused frustration, teams can move from identification to hypothesis-building in seconds rather than hours.
Intelligence at Scale: The Role of "Wingz" AI
As datasets grow, manual analysis becomes a bottleneck. Wingify has addressed this by embedding "Wingz," an agentic AI, into the heart of the analytics layer.
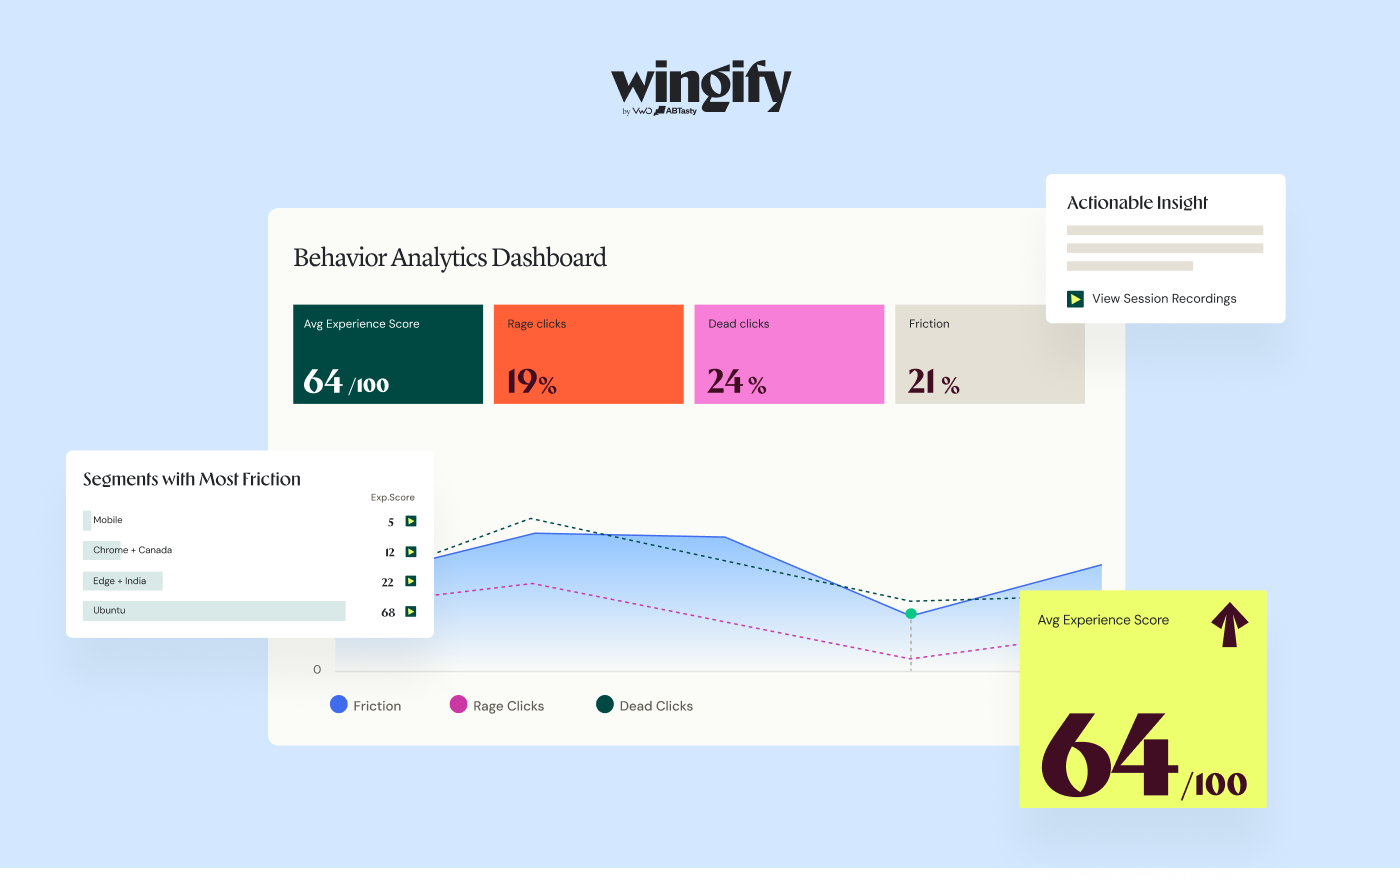
Wingz acts as a force multiplier for data teams. Instead of spending hours digging through filters, a user can simply ask, "Why did our checkout conversion rate dip by 15% this week?" Wingz processes the quantitative data, scans the behavioral recordings tied to that specific period, identifies patterns (such as a browser compatibility issue or a confusing form field), and provides a summary. Crucially, it then suggests a remediation strategy, potentially linking to an A/B test setup to validate the fix.
Implications: A New Era for Digital Experience Optimization
The introduction of Journey Analytics has profound implications for the industry. First, it democratizes data analysis. By removing the need for heavy engineering intervention to set up tracking, non-technical team members—such as UX designers, marketers, and product owners—can become autonomous in their optimization efforts.
Second, it shifts the focus from "data collection" to "data action." In the current climate, where budgets are scrutinized and ROI must be proven, the ability to rapidly iterate based on evidence is a competitive advantage. The integration of analytics with the testing suite means that every finding has a clear, actionable path to implementation.
Finally, for organizations that already possess a robust data stack (like Google Analytics or Mixpanel), Wingify has designed Journey Analytics to be complementary. Because the platform excels at the "behavioral" side of the equation, it fills the gap left by traditional tools that may track numbers well but fail to provide the qualitative context necessary for conversion rate optimization.
Conclusion: The Path Forward
The launch of Journey Analytics is a testament to the evolving needs of the digital enterprise. By collapsing the distance between a question and an answer, Wingify is enabling teams to operate with a level of agility that was previously unattainable.
In an environment where every millisecond of user experience matters, the luxury of "back-and-forth" between different tools is a cost most companies can no longer afford. With Journey Analytics, Wingify isn’t just offering another dashboard; they are offering a unified workflow designed to turn insight into revenue.
As teams begin to integrate this layer into their daily operations, the expectation is clear: less time spent diagnosing problems, and more time spent delivering the experiences that drive growth. For those looking to see the platform in action, Wingify has opened registration for personalized demonstrations, signaling a new chapter in the company’s mission to make digital optimization accessible, fast, and profoundly effective.