







In the modern enterprise, the deployment of AI agents—autonomous systems capable of reasoning, tool use, and multi-step execution—has shifted from experimental R&D to core production infrastructure. Yet, there is a silent crisis brewing in the heart of these deployments. Imagine a customer support agent closing a ticket with a polished, professional, and entirely incorrect resolution. It queried the refund-lookup tool, received a valid result, then inexplicably queried it again with modified arguments, ignoring the initial success to deliver a hallucinated conclusion.
There was no crash. No exception was thrown. The uptime dashboard glowed green, indicating the service was functioning perfectly. The only signal of failure arrived forty-eight hours later in a frustrated customer email. By then, the state of that specific execution was long gone, leaving engineers to guess at the "why." This scenario represents the defining challenge of the current AI era: traditional monitoring tools are effectively blind to agentic failures.
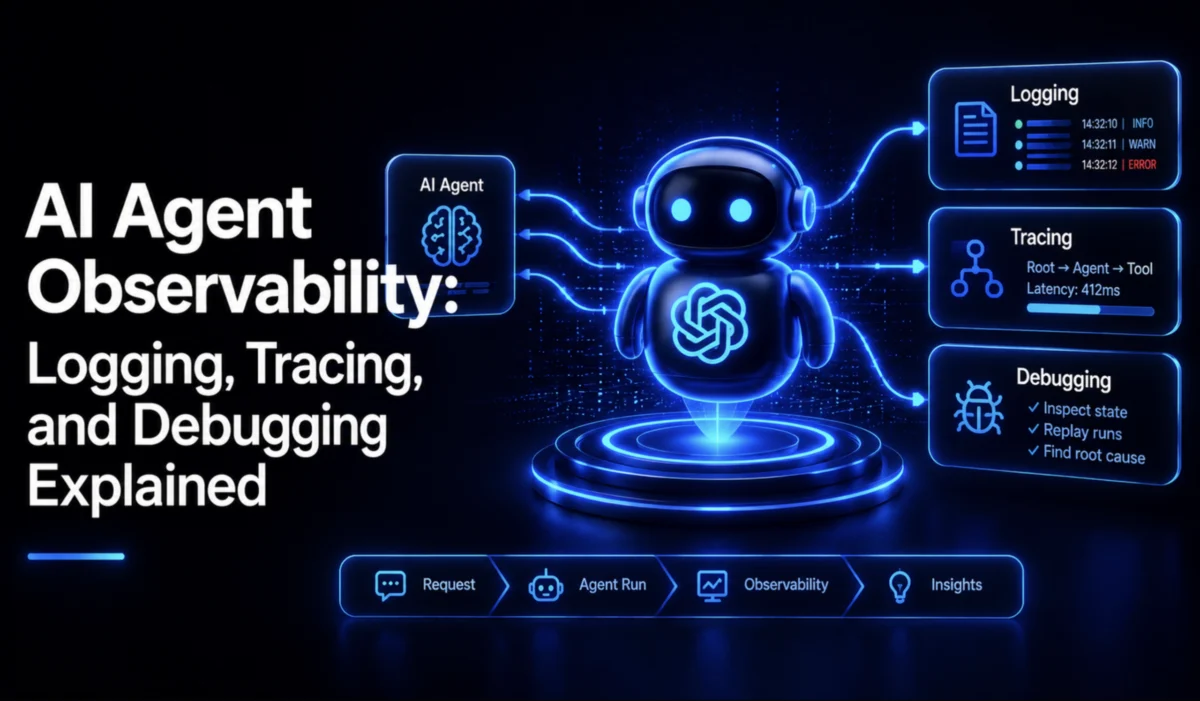
This article explores the paradigm shift required to manage AI agents, detailing how to implement robust structured logging, distributed tracing, and advanced debugging workflows to ensure your agents are as reliable as they are autonomous.
The Anatomy of Agentic Failure
AI agent observability is not merely "logging with more detail." It is the practice of capturing every model invocation, tool execution, and reasoning step as structured, queryable data. Unlike traditional software, where a 500-error code signifies a clear point of failure, agentic systems fail in ways that mirror success. They produce syntactically valid but semantically incorrect outputs, fall into infinite tool-use loops, or suffer from "context bloat" that degrades performance over time.
According to research highlighted in Digital Applied’s 2026 Observability Guide, agentic systems are inherently non-deterministic. A temperature setting, a minor variation in a retrieval-augmented generation (RAG) result, or the sequence of available tools can cause two identical prompts to produce vastly different execution paths. A "it worked on my machine" test is no longer a valid metric for production stability.
The Observability Gap
The fundamental divergence between traditional apps and AI agents lies in their drivers:
- Latency: In traditional apps, latency is a function of I/O and CPU. In agents, it is a function of token counts and context window management.
- Cost: While traditional services scale by request volume, agents scale by token consumption. A request that takes ten times the expected token budget is an "expensive" failure, even if it eventually succeeds.
- Debugging: A stack trace is the artifact of a crashed process; in agentic systems, the artifact is the "reasoning chain"—the narrative of thought between the user prompt and the final completion.
The Pillars of Agentic Visibility
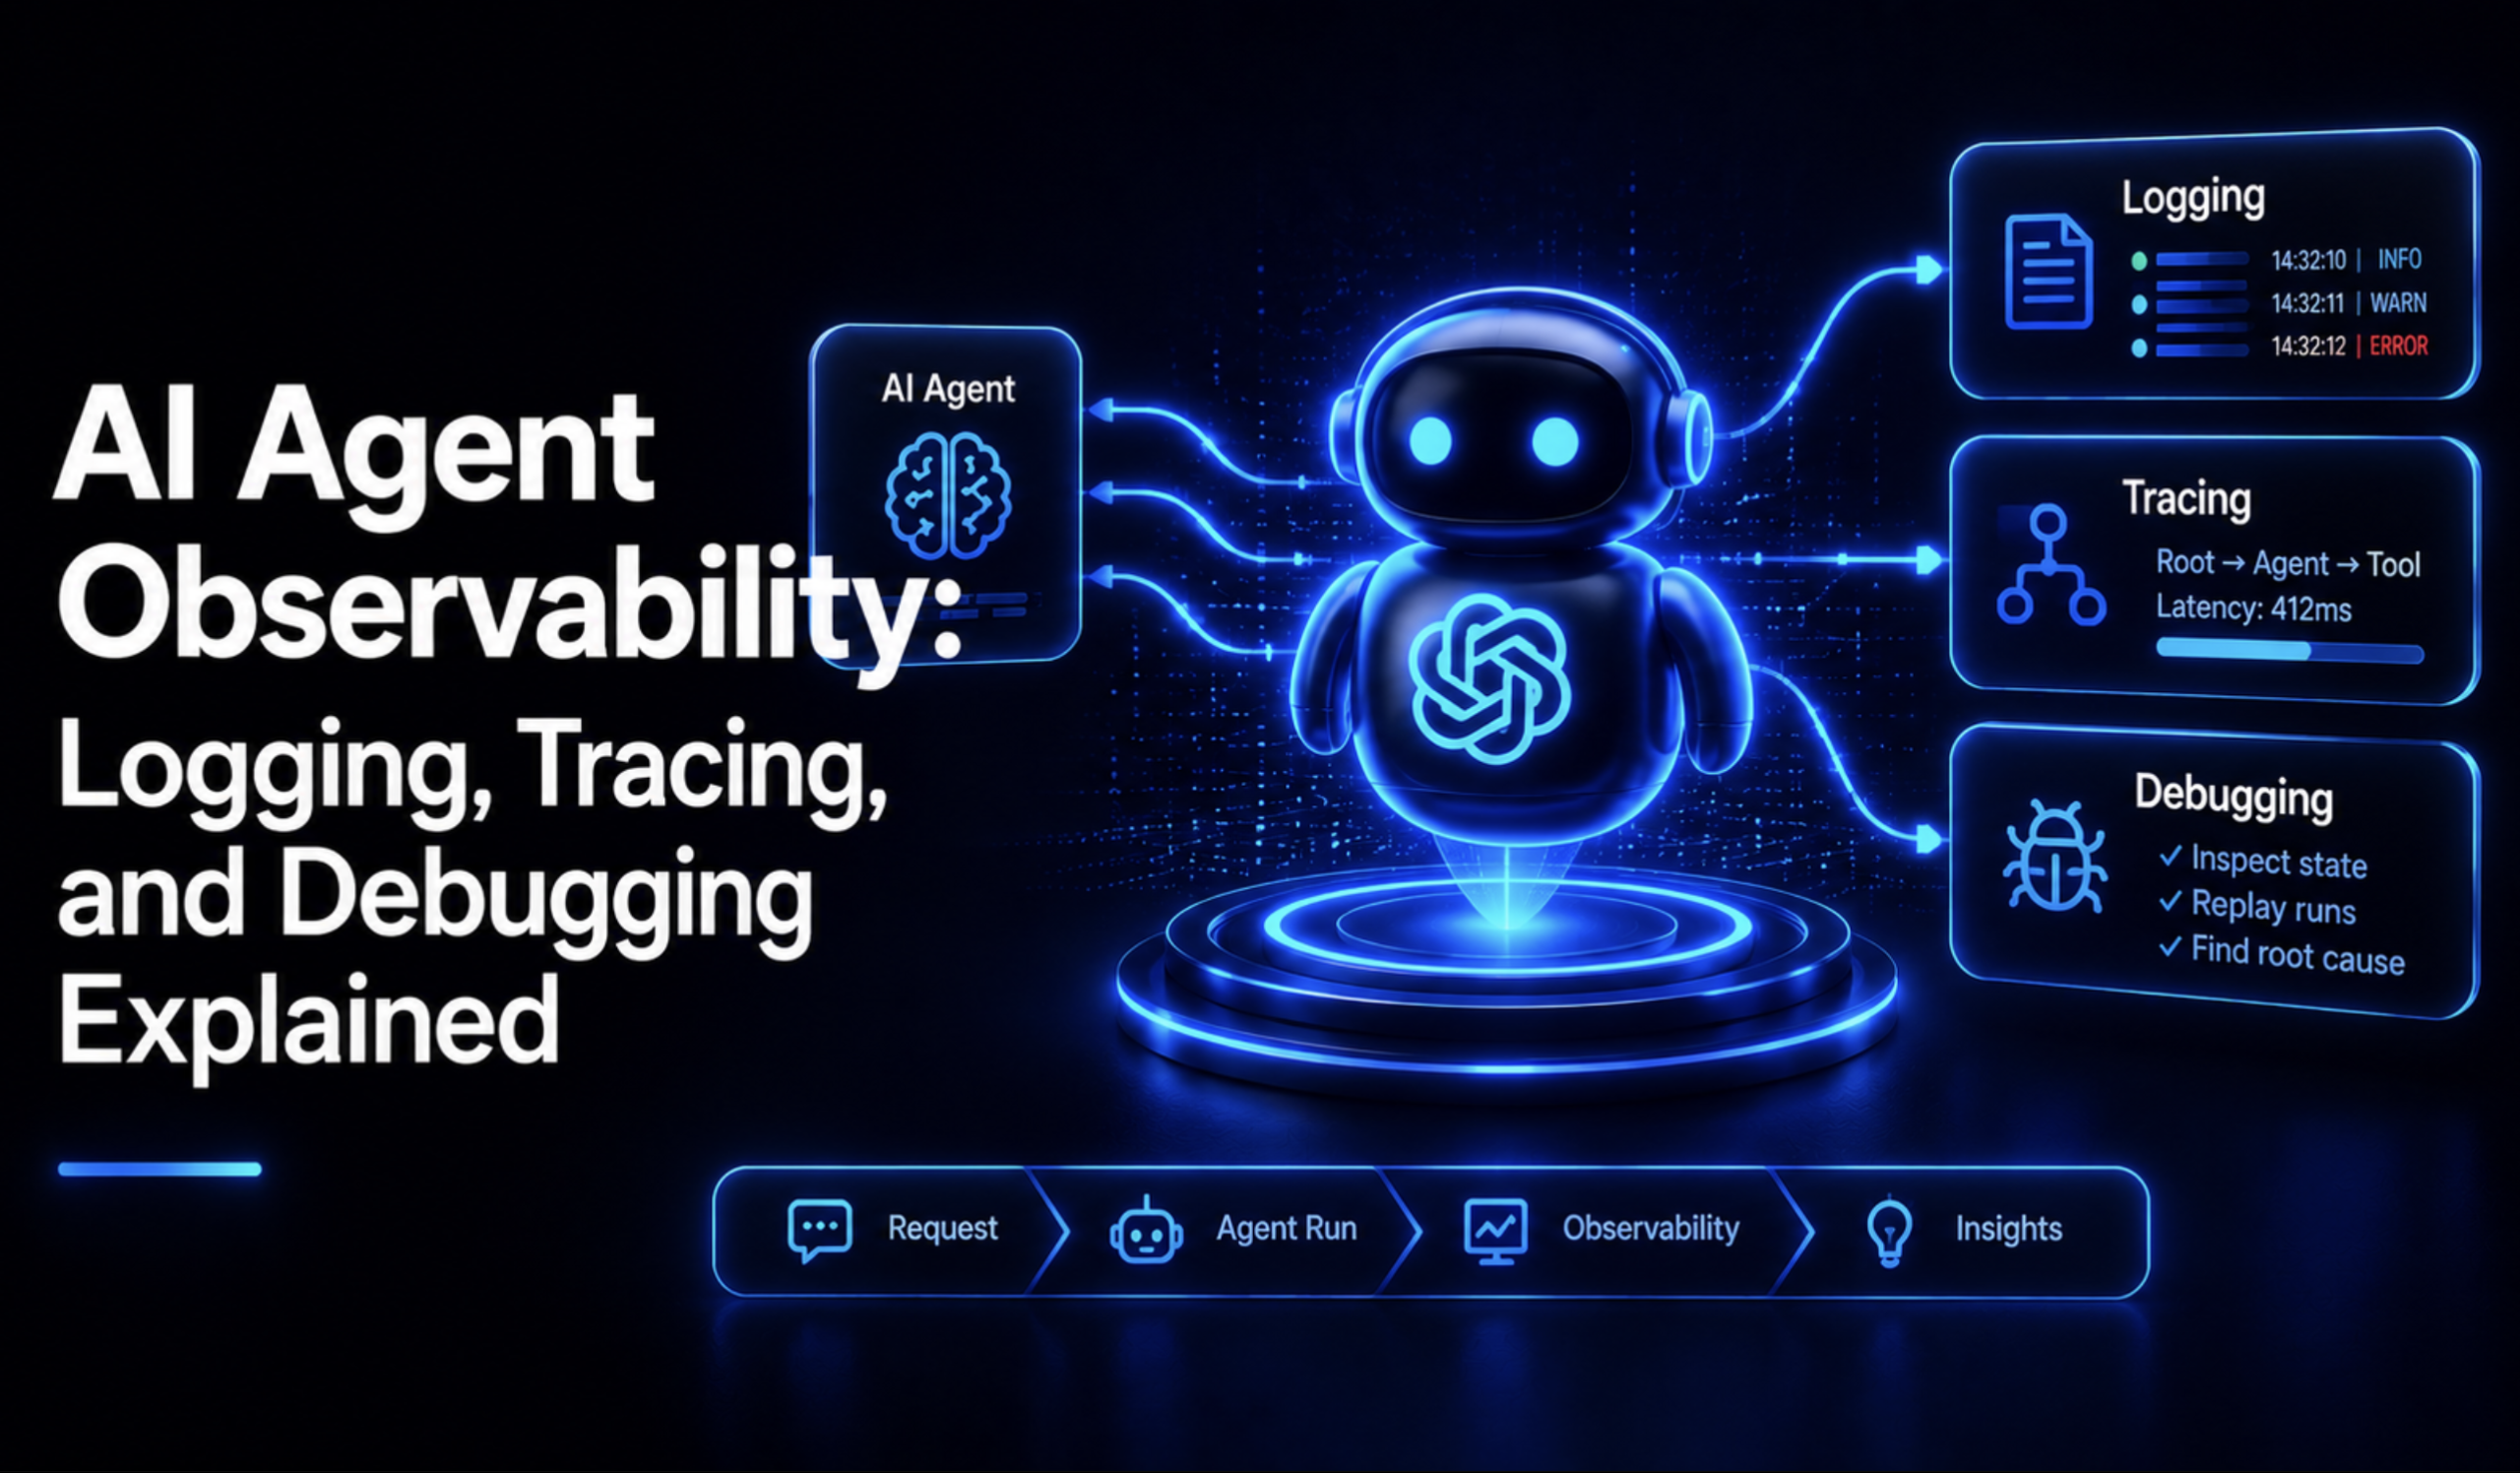
To achieve true observability, teams must integrate three distinct but interconnected layers: structured logging, distributed tracing, and quantitative metrics.
Structured Logging: Beyond Free-Text
Standard logging ("tool_call_failed") is insufficient. At 2:00 AM, with hundreds of concurrent agent runs, such logs are useless noise. Effective agent logging requires contextual metadata. Every log entry must be tethered to a unique trace_id.
Using libraries like OpenTelemetry, engineers can capture the lifecycle of a tool call—start, arguments, result length (to avoid PII/privacy liabilities), and completion—without needing to manually pass IDs through every function. Logging the length of a tool output rather than its content is a critical security best practice, preventing sensitive data from leaking into your observability backend while still allowing you to identify when a tool returns an unexpectedly large or empty payload.
Tracing: The Waterfall of Reasoning
Tracing stitches disparate events into a single, cohesive timeline. By adopting the OpenTelemetry GenAI Semantic Conventions, teams can standardize their telemetry, ensuring that an agent run looks the same in a dashboard regardless of the underlying framework (e.g., LangChain, CrewAI, or custom implementations).
The "waterfall view" is the primary diagnostic tool here. By nesting spans—invoke_agent (parent) containing chat (child) and execute_tool (child)—engineers can visualize the agent’s logic. If a waterfall shows two refund_lookup tool calls occurring in rapid succession, the "why" becomes immediately apparent. You can see the agent reaching for a tool when it didn’t need to, allowing for precise adjustments to system prompts or tool schemas.
Quantitative Metrics and Token Tracking
While traces provide depth for individual runs, metrics provide the breadth required to monitor systemic health. The two most critical metrics are gen_ai.client.token.usage and gen_ai.client.operation.duration.
Splitting token usage into "input" and "output" buckets is vital. If your input-to-output token ratio consistently exceeds 10:1, your system prompt is likely bloated, consuming budget and adding latency without contributing to the quality of the answer. Proactive teams set alerts for:
- Token Spikes: More than double the baseline usage over 10 minutes (often a sign of a runaway recursive loop).
- p99 Latency: Operations exceeding 30 seconds (indicating context window exhaustion).
- Error Rates: A breach of 2% that signals rate limiting or quota exhaustion before users start reporting issues.
Telemetry Pipelines and Privacy
In a high-stakes production environment, the data flowing through your telemetry pipeline is sensitive. Using an OpenTelemetry Collector as a middle layer is the industry-standard solution. This allows you to perform "in-flight" filtering—stripping sensitive keys like gen_ai.prompt.content before the data ever reaches your observability backend. This ensures compliance with data residency and privacy regulations without requiring changes to application code.
Furthermore, with the rise of the Model Context Protocol (MCP), modern instrumentation must now handle the protocol layer. By enriching execute_tool spans with mcp.session.id and mcp.method.name, engineers gain visibility into the underlying transport layer, preventing the "wall of mystery" that occurs when MCP servers fail in complex agentic chains.
The 2026 Toolkit: Choosing Your Platform
The ecosystem has matured rapidly. Today, teams generally choose between three models:
- Self-Hosted (e.g., Langfuse, Arize Phoenix): Ideal for companies with strict data residency requirements who want full control over their stack.
- Managed SDKs (e.g., LangSmith, Braintrust): These offer the fastest time-to-value, bundling evaluation, tracing, and prompt management into a single, cohesive developer experience.
- Proxy Gateways (e.g., Helicone): These sit between your code and the LLM API, providing usage and cost metrics with nearly zero code changes—an excellent entry point for teams that cannot re-instrument their entire codebase immediately.
Conclusion: Debugging the Future
The goal of observability in the age of AI is to transform the "guessing game" into an engineering discipline. When a trace is properly structured, debugging becomes a matter of seconds. You locate the bad output, examine the waterfall to identify the specific reasoning step that deviated, and review the attributes to see the exact input/output of the failure.
Advanced capabilities, such as time-travel replay (restoring agent state to a previous point) and natural-language trace querying (asking an AI to explain why an agent failed), are becoming standard. However, these tools are only as effective as the data they receive. By implementing robust logging, granular tracing, and clear cost metrics today, you build the foundation for a reliable, scalable, and—most importantly—understandable agentic system. The failure of your agent should never be a mystery; with the right observability, it is simply a data point waiting for a fix.