









Every month, more than 50,000 developers from every corner of the globe converge on DavidWalshBlog, seeking solutions to complex JavaScript puzzles and guidance on code optimization. For a site that serves as a cornerstone of the developer community, performance is not just a technical metric—it is a commitment to the user experience. However, recent data indicated that despite the blog’s popularity, a significant portion of the audience was struggling with a suboptimal, sluggish browsing experience.
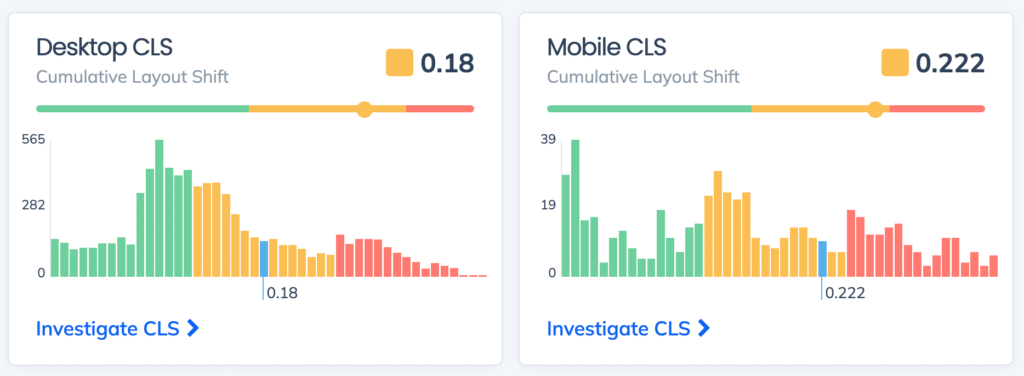
To address this, we turned to the granular data provided by Request Metrics. The findings were clear: while the site remained functional, its Cumulative Layout Shift (CLS) scores—a critical component of Google’s Core Web Vitals—were trending in the wrong direction for both desktop and mobile users. This deep dive explores the anatomy of that performance decline, the fallibility of synthetic testing, and the systematic approach taken to restore the site to peak efficiency.
The Metrics That Matter: Understanding CLS
In the landscape of modern web performance, "load time" is an incomplete story. A site might load quickly but leave the user frustrated by content that jumps around, causing misclicks and visual disorientation. This is where Cumulative Layout Shift (CLS) becomes essential.
CLS measures the total sum of all individual layout shift scores for every unexpected layout shift that occurs during the entire lifespan of a page. In simpler terms, it quantifies how much the page "jumps" while it is rendering. When an element—be it an image, an advertisement, or a dynamic font—loads after the initial paint, it can push existing content downward or sideways.
For users, this is more than a minor annoyance; it is a breakdown of trust. For site owners, it is a direct hit to search engine optimization (SEO). Google has explicitly integrated Core Web Vitals into its ranking algorithms, meaning that sites with poor CLS scores are penalized in search results. For bloggers, e-commerce stores, and digital publishers, search traffic is the lifeblood of their operation. A fix for CLS is not just a technical "nice-to-have"; it is a vital business strategy.
The Illusion of Perfection: Why Lighthouse Isn’t Always the Answer
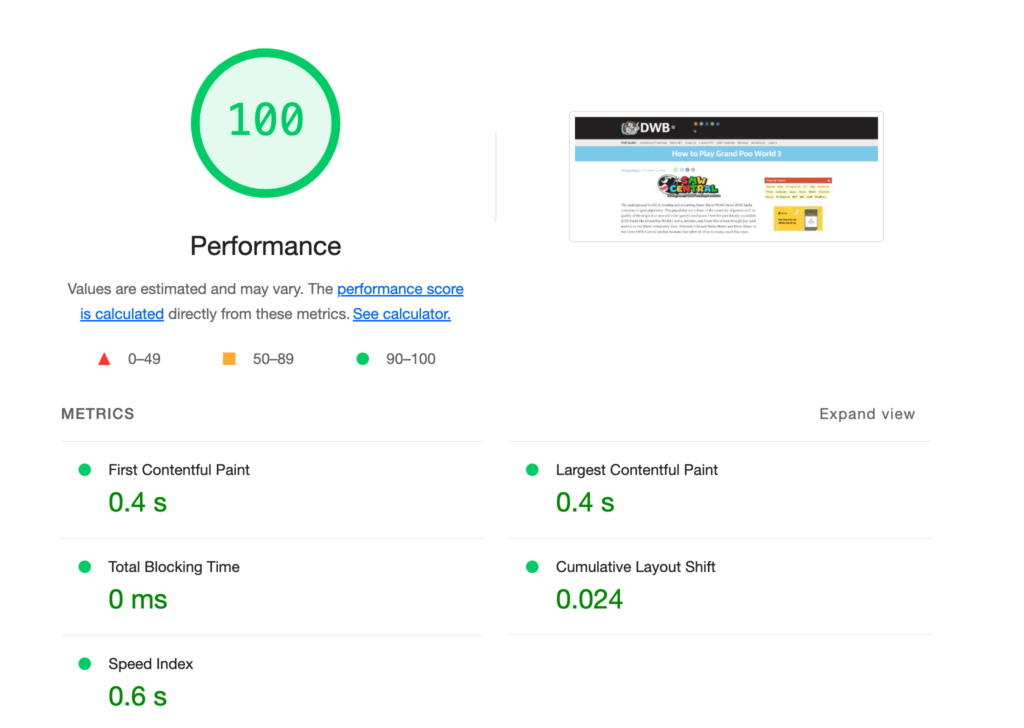
When developers hunt for performance bottlenecks, the first instinct is often to reach for Google Lighthouse. It is a powerful, industry-standard tool, and when we ran a report on DavidWalshBlog, the results were seemingly perfect. The report returned a pristine score, suggesting that the site was firing on all cylinders.
If we had stopped there, we would have been misled.
The truth is that Google Lighthouse is, in many respects, a controlled simulation. It performs a single test, typically from a high-speed server, using a powerful machine, under ideal network conditions. It does not account for the "real world"—the user in a rural area on a 3G connection, the mobile user on an aging smartphone, or the fluctuating latency of public Wi-Fi.
David’s actual audience is global and diverse. Their devices vary, their networks fluctuate, and their experiences are far from the "lab-perfect" conditions of a synthetic test. This is why Real User Monitoring (RUM) is indispensable. By tracking actual visitor sessions, we realized that while the site looked fast in a lab, it was buckling under the realities of the wild. Relying solely on synthetic metrics is akin to testing a car’s engine in a vacuum; it may run perfectly, but it tells you nothing about how it handles the open road.
Chronology of a Performance Audit
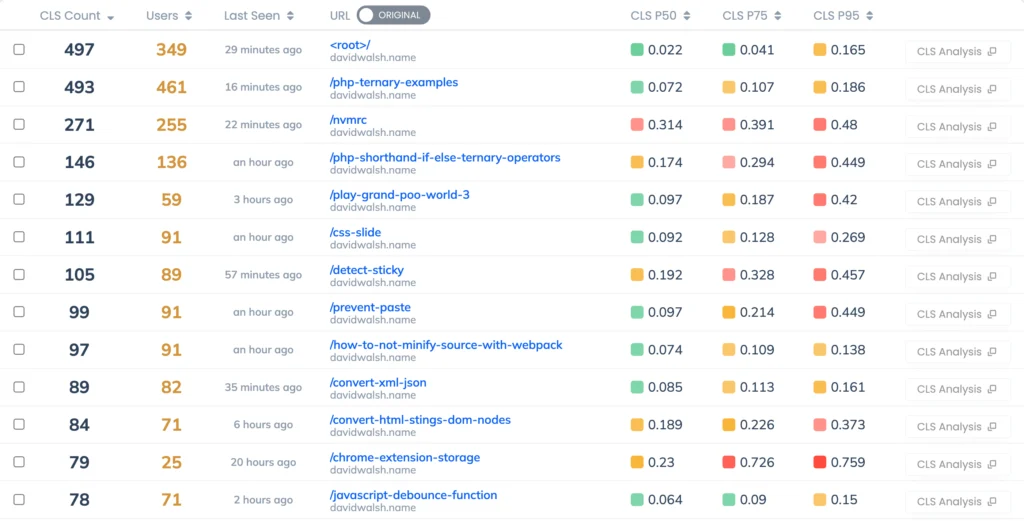
Once we shifted our focus from synthetic data to real-world performance, the path forward became clear. We utilized the tracking capabilities of Request Metrics to drill down into the performance of specific pages.
The audit revealed a troubling pattern: while the site’s root page maintained a healthy CLS, individual posts—specifically high-traffic articles—were suffering from significant layout shifts. By analyzing the elements responsible for these shifts, we identified a consistent culprit: main > article > p.
The first paragraph of these articles was consistently being displaced during the initial load. By cross-referencing this with the site’s content structure, the answer became apparent: Images.
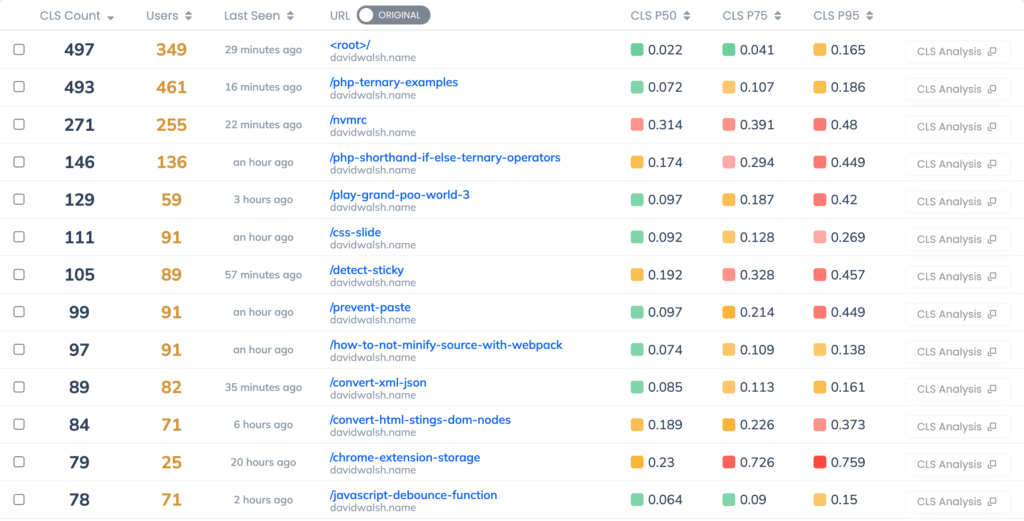
In the early days of the web, browsers would render content as it arrived. If an image didn’t have defined dimensions, the browser would reserve 0x0 pixels for it, render the surrounding text, and then, upon downloading the image, force a sudden, jarring shift to accommodate the new visual content. This "pop-in" effect is the primary driver of high CLS scores. For long-form posts featuring multiple images, this shift occurred repeatedly as each image loaded, creating a "stuttering" effect that alienated readers.
Implementing the Fix: Establishing Visual Stability
To solve the issue, we had to provide the browser with "hints." By explicitly defining the expected dimensions of an image before it hits the network, the browser can allocate the correct amount of space in the layout immediately.
The fix was straightforward but required precision. We implemented the standard HTML width and height attributes:
<img src="/path/to/image" width="300" height="100" />Crucially, these attributes are not CSS properties. They define the aspect ratio at the DOM level, allowing the browser to reserve the "slot" for the image even before it has fetched a single byte of data. By avoiding specific units like px in these attributes, we ensure the browser handles the scaling responsively based on the CSS rules applied elsewhere.
Given that DavidWalshBlog is built on WordPress, we leveraged the built-in wp_image_src_get_dimensions function. This allowed us to automate the retrieval of image metadata and inject it directly into the markup of the posts. This systematic approach meant that we didn’t have to manually edit hundreds of individual articles; the platform handled the heavy lifting.
The Results: A Measurable Shift
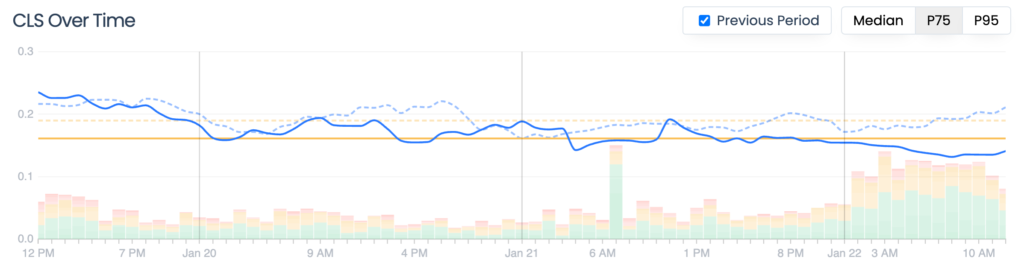
The impact of these changes was near-immediate. By providing the browser with the necessary structural information, we effectively eliminated the "shifting" behavior that was plaguing the user experience.
Within days of deploying the fix, we observed a 20% improvement in the site’s aggregate CLS score, bringing it down to 0.123. The site is now hovering at the precipice of the "Good" range—a threshold that Google defines as the gold standard for user experience.
While the battle for performance is never truly over—we still have to address issues regarding font rendering and asynchronous script loading—this victory represents a significant milestone. The blog is now objectively faster and more stable, ensuring that the content remains the focal point of the reader’s experience rather than the layout itself.

Implications for the Broader Web
The story of DavidWalshBlog serves as a microcosm for the modern web. Performance is no longer a luxury; it is a fundamental aspect of digital craftsmanship. As Google continues to refine its search algorithms to prioritize user experience, the gap between "performant" and "poor" sites will widen.
For developers and site owners, the implications are three-fold:
- Synthetic Testing is Not Enough: Tools like Lighthouse are useful for debugging, but they cannot replace the insights gained from tracking real user data. If you aren’t measuring how your site performs for your actual audience, you are effectively flying blind.
- Layout Stability is a Priority: Cumulative Layout Shift is one of the easiest metrics to fix, yet it is one of the most detrimental to the user experience. Simply auditing your images and providing height and width attributes can yield immediate, tangible results.
- Proactive Optimization Pays Off: By investing in performance, you are investing in your own visibility. Better Core Web Vitals lead to higher search rankings, which in turn lead to increased traffic and, ultimately, a larger community.
If you are concerned about your own site’s performance or the potential impact of Core Web Vitals on your SEO, consider utilizing Request Metrics. It provides the diagnostic tools necessary to move from guesswork to actionable improvement. In an era where every millisecond counts, the ability to monitor and refine your site’s performance is not just an advantage—it is a necessity.
As we look toward the next set of optimizations for DavidWalshBlog, the takeaway remains clear: performance is a journey, not a destination. By staying vigilant and grounded in real-world data, we can ensure that the web remains a fast, reliable, and accessible space for developers worldwide.