









Main Facts: The Eternal Tug-of-War Between Rigor and Reality
In the high-stakes theater of digital product development, a familiar drama plays out daily. A company implements a major platform overhaul—such as a brand-new, multi-step checkout process—driven by industry benchmarks and stellar UI/UX best practices. Data professionals, advocating for methodological purity, urge stakeholders to run a properly designed randomized controlled trial (A/B test) to validate the hypothesis, quantify the impact, and reject the null hypothesis.
Inevitably, the request is bypassed. Pressure mounts, executive consensus takes the wheel, and the feature launches without a control group.
One month later, the inevitable reckoning arrives. Leadership swarms the analytics team with pointed inquiries: What is the actual effect of the new checkout? Did it work? Did we bleed revenue?
For years, quantitative analysts facing this precise dilemma have relied on quasi-experimental techniques like Difference-in-Differences (DiD) or Synthetic Control Methods (SCM). Yet, these frameworks hit an insurmountable wall when a company lacks comparable external markets or sufficient scale to build a credible synthetic control group.
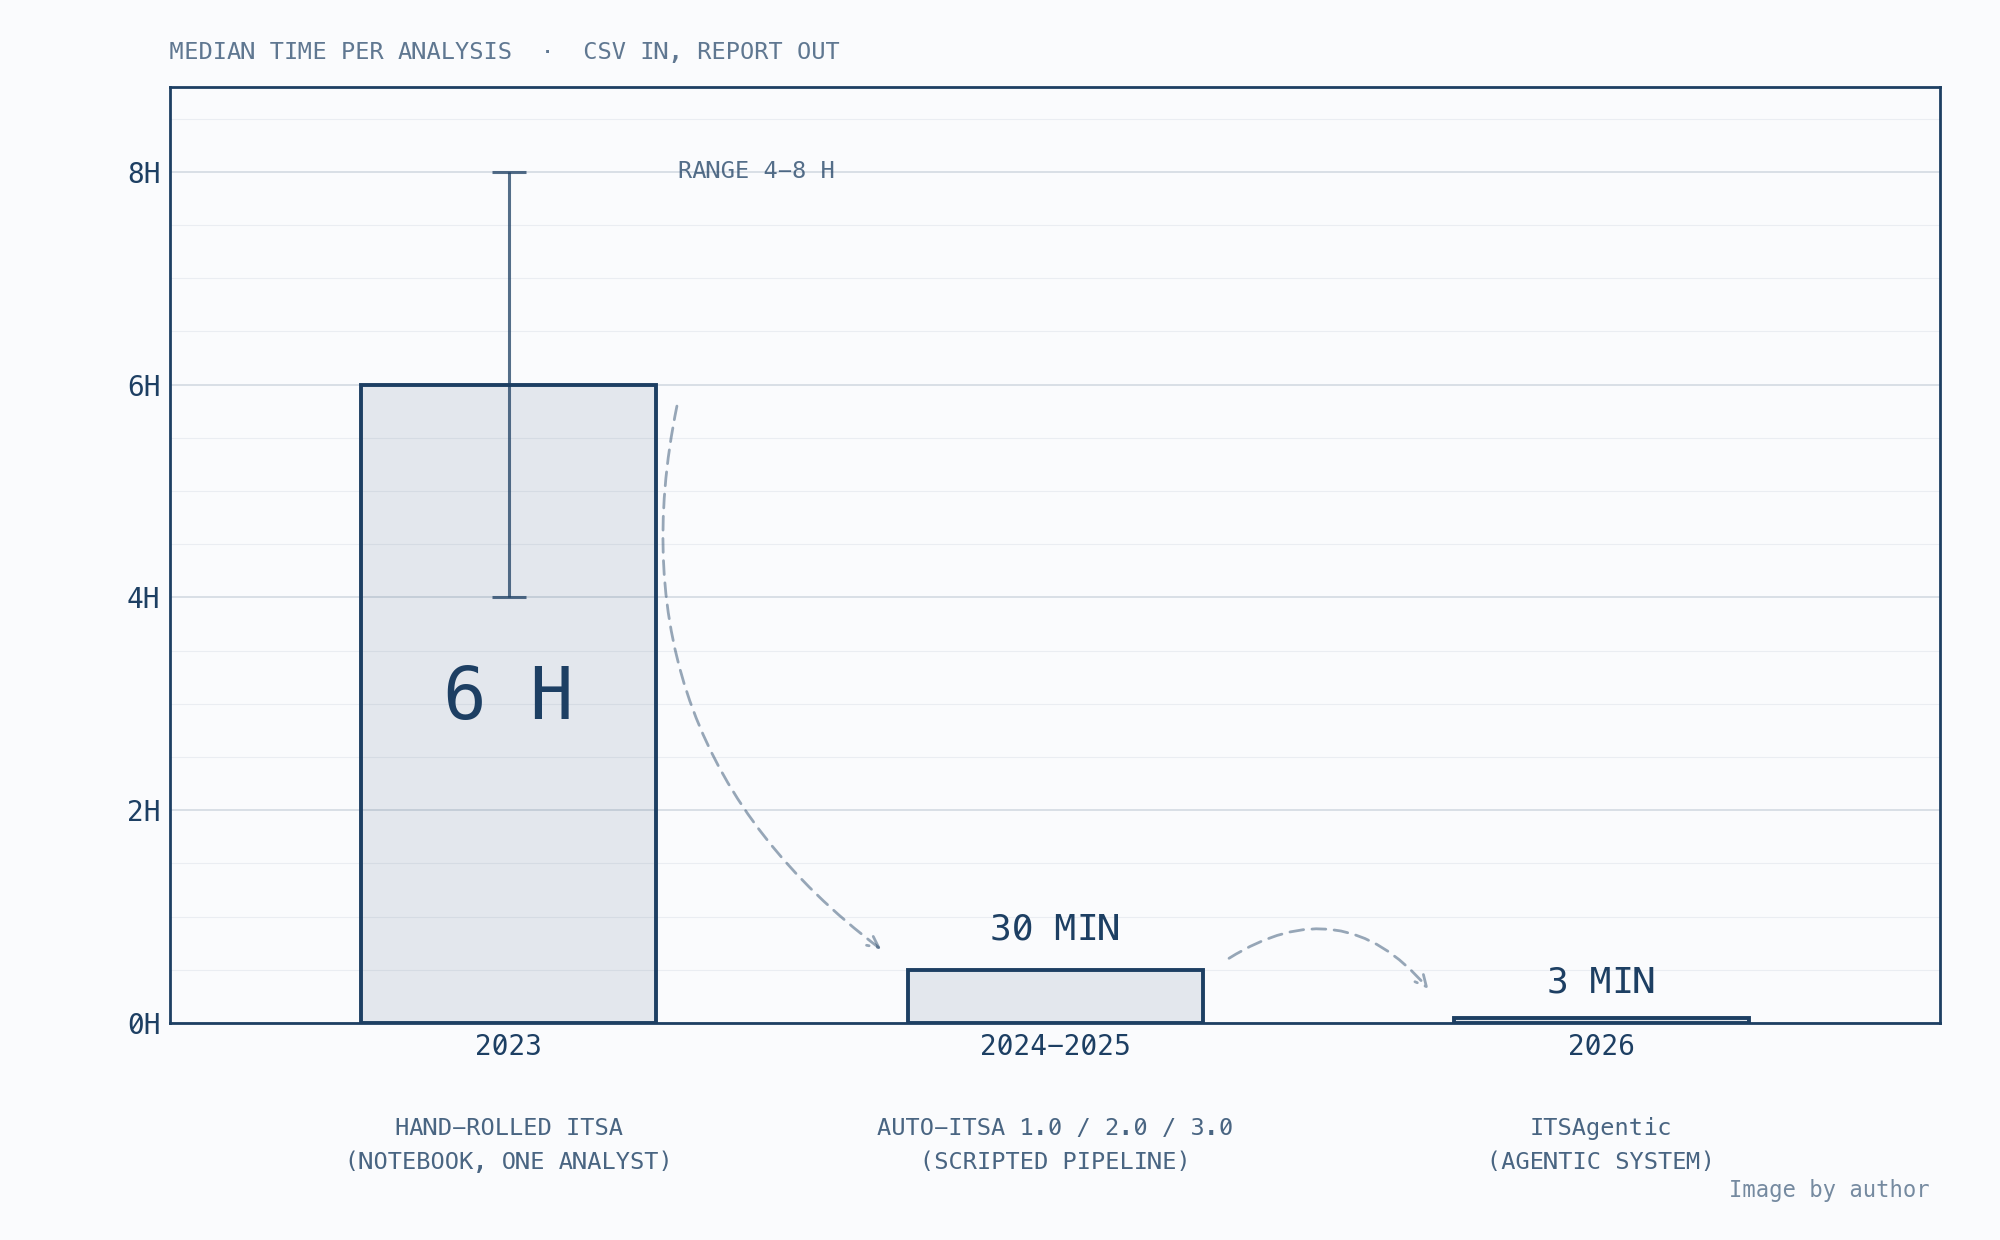
This is the exact operational crisis that birthed Interrupted Time Series Analysis (ITSA), and more recently, ITSAgentic—a pioneering multi-agent AI framework designed to automate, standardize, and scale counterfactual impact analysis. By leveraging a collaborative architecture of specialized Large Language Models (LLMs) and deterministic Python engines, this system compresses a six-hour manual data science workflow into a seamless three-minute automated deliverable.
Chronology: From Manual Notebooks to Autonomous Agentic Pipelines
The technological evolution that led to ITSAgentic spans several distinct phases of digital experimentation maturity, transforming an artisanal statistical craft into an industrial-grade AI product.
2023: The Artisanal Era
When the online experimentation team first operationalized ITSA to evaluate interventions outside traditional A/B testing boundaries, the process was entirely manual. Data scientists manually pulled data into notebooks, cleaned time series vectors, evaluated stationarity, and coded segmented regressions by hand.
- The Toll: A median of 6 hours (ranging from 4 to 8 hours) per analysis, severely limiting organizational throughput.
2024–2025: The Rise of "Auto-ITSA"
Recognizing the bottleneck, engineers constructed Auto-ITSA, an internal scripted Python pipeline. This automated tool ingested raw CSV inputs and—based on parameters like intervention dates and metric types—automatically determined the appropriate statistical model (Ordinary Least Squares, Weighted Least Squares, or Negative Binomial distributions) to build a credible counterfactual.
- The Gain: Standardization improved dramatically, cutting analysis time down to a median of 30 minutes.
- The Catch: As teams demanded richer visual graphs, wider scenario flexibility, and support for diverse econometric libraries, Auto-ITSA 3.0 grew increasingly complex. Parameterizing the tool required deep statistical expertise, introducing a steep friction curve that eroded time-to-value.
2026: The Inception of ITSAgentic
With the dramatic leap in LLM reasoning capabilities, early 2026 marked the birth of ITSAgentic. Recognizing that prompt engineering alone produces unreliable wishlists rather than rigorous guardrails, the architecture was designed with a strict separation of concerns: deterministic Python tools for hard arithmetic, and reasoning LLMs exclusively for strategic diagnosis and executive storytelling. Today, the median time to deliver a complete, audit-ready ITSA report stands at just 3 minutes.
Supporting Data: The Anatomy of Counterfactual Precision
To understand why ITSAgentic represents a paradigm shift, one must first understand the statistical pitfalls it was engineered to avoid.
The Naive Pre/Post Trap
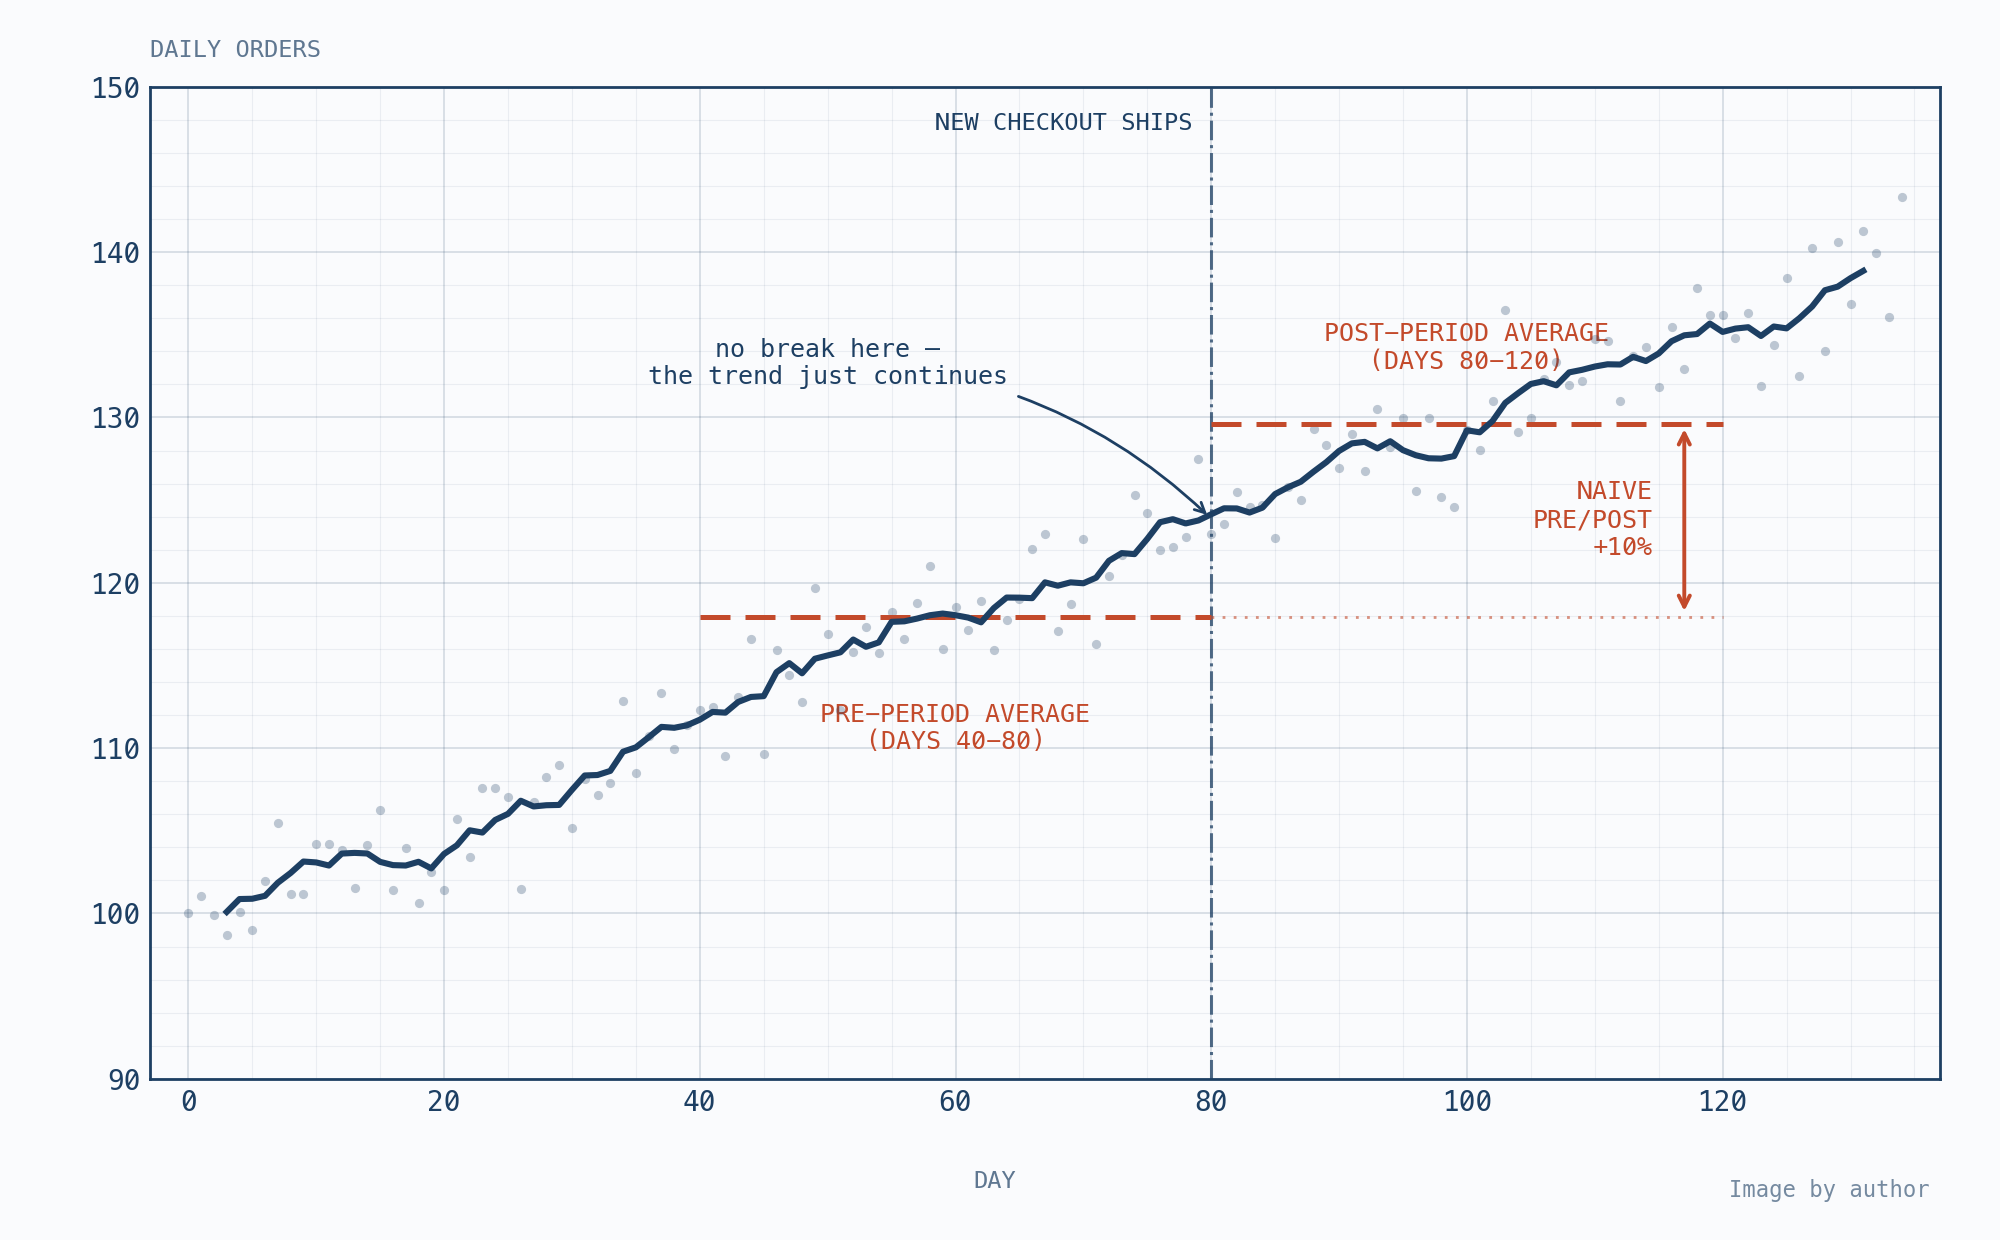
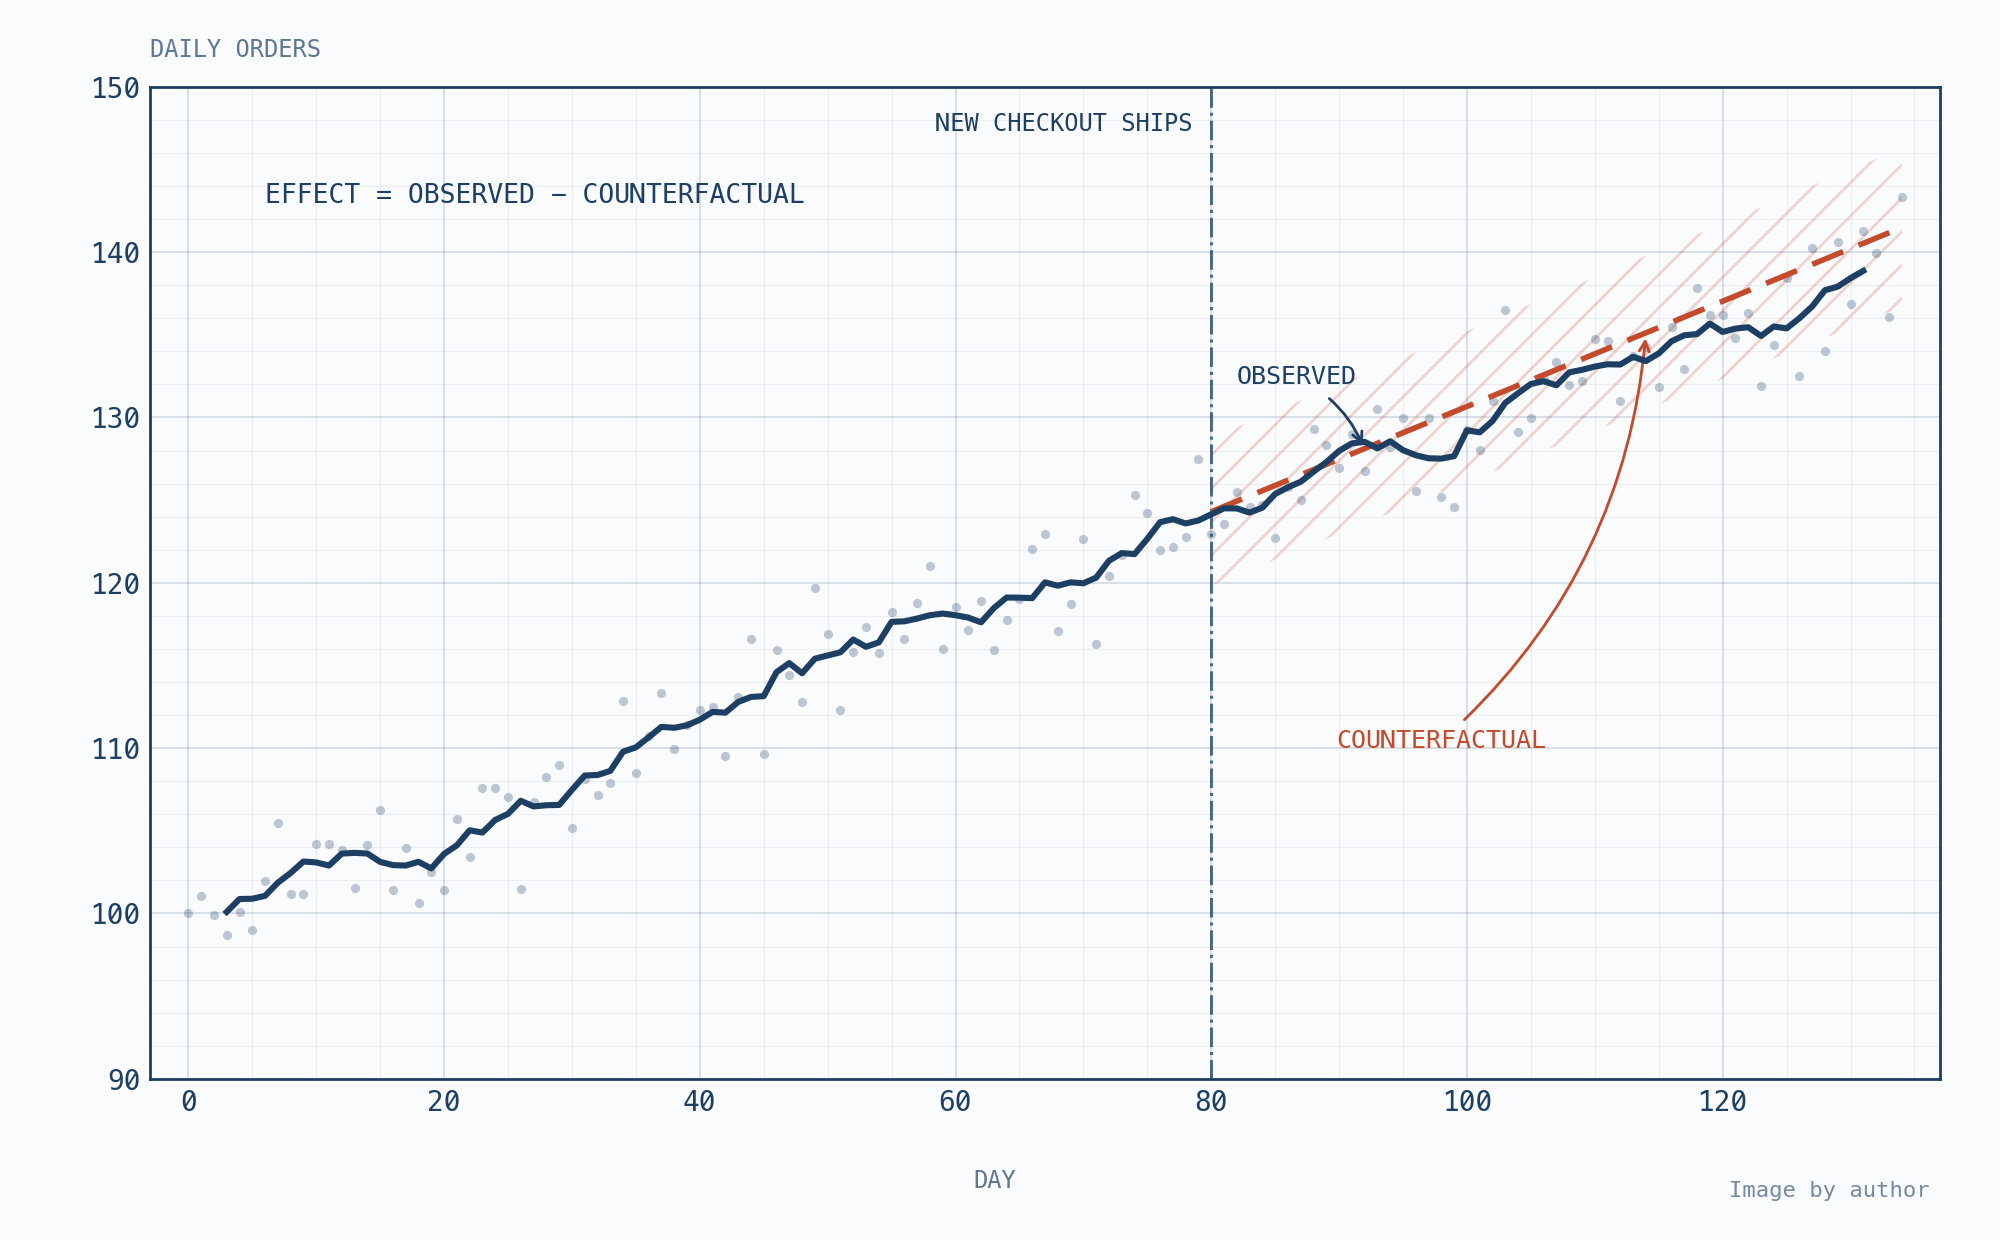
In fast-growing digital businesses, comparing the mean performance of a metric after an intervention to its mean before the intervention is a deeply flawed methodology. Consider a simulated series of daily orders climbing steadily from 100 to 140 over 130 days. If a new checkout ships on day 80, but the upward trend simply continues without a structural break, a naive pre/post comparison will compute a spurious "+10% lift."
In reality, the intervention caused zero change; the pre-existing organic trend drove the growth. Naive comparisons fail because they ignore:
- Pre-existing trends and seasonality.
- Autocorrelation, leading to wildly miscalculated uncertainty bounds.
- Concurrent external shocks that contaminate the evaluation window.
The True Definition of Causal Effect
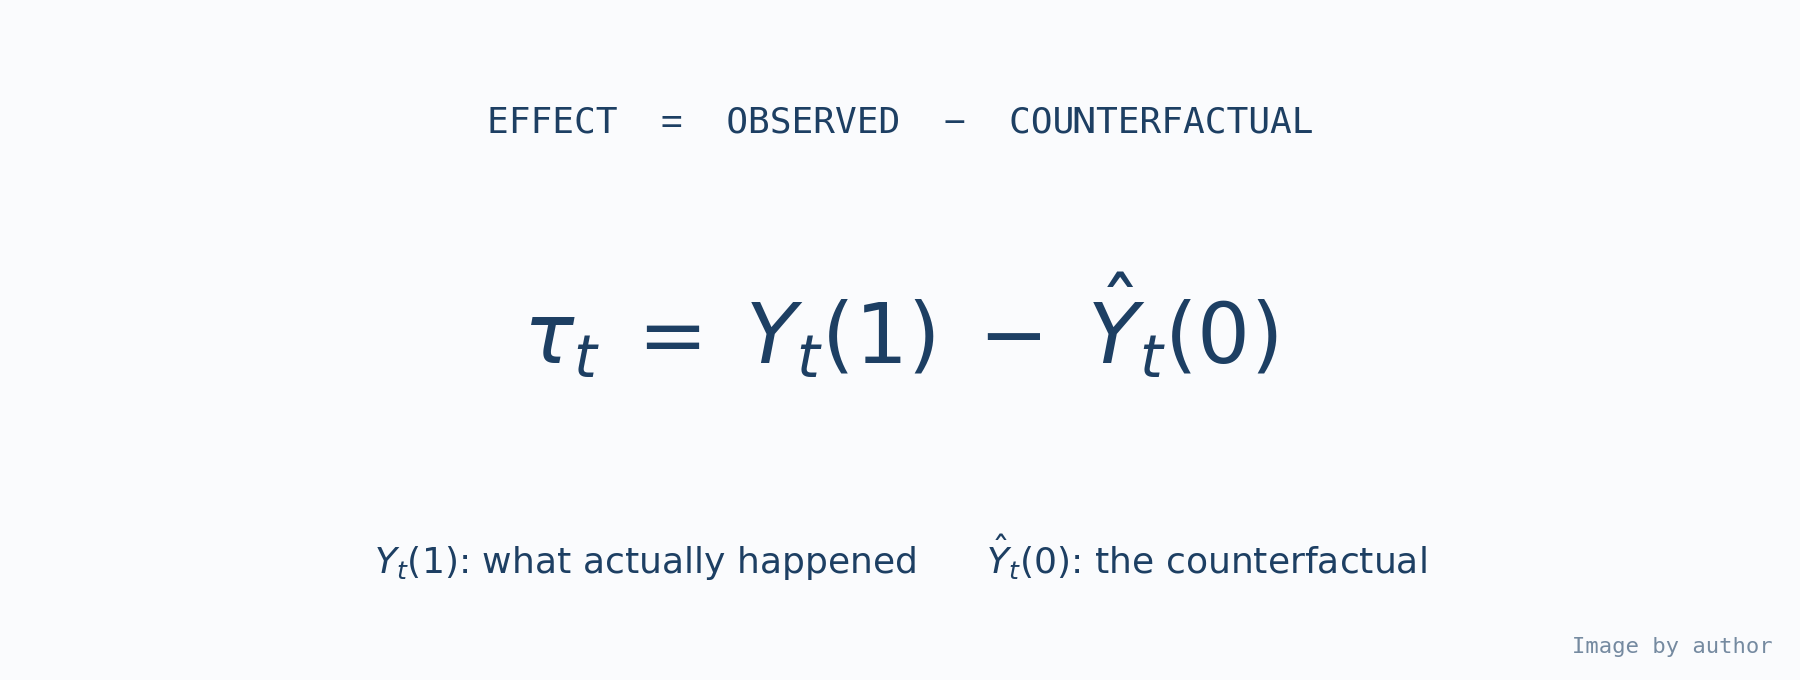
Interrupted Time Series Analysis circumvents this trap by evaluating the counterfactual—what would have happened had the intervention never occurred. Formally, the causal effect ($tau_t$) at any given time $t$ is expressed as:
$$tau_t = Y_t(1) – hatY_t(0)$$
Where $Y_t(1)$ represents the observed post-intervention reality, and $hatY_t(0)$ represents the estimated counterfactual trajectory projected forward from the pre-intervention baseline.
Benchmark Evolution and Evaluation Metrics
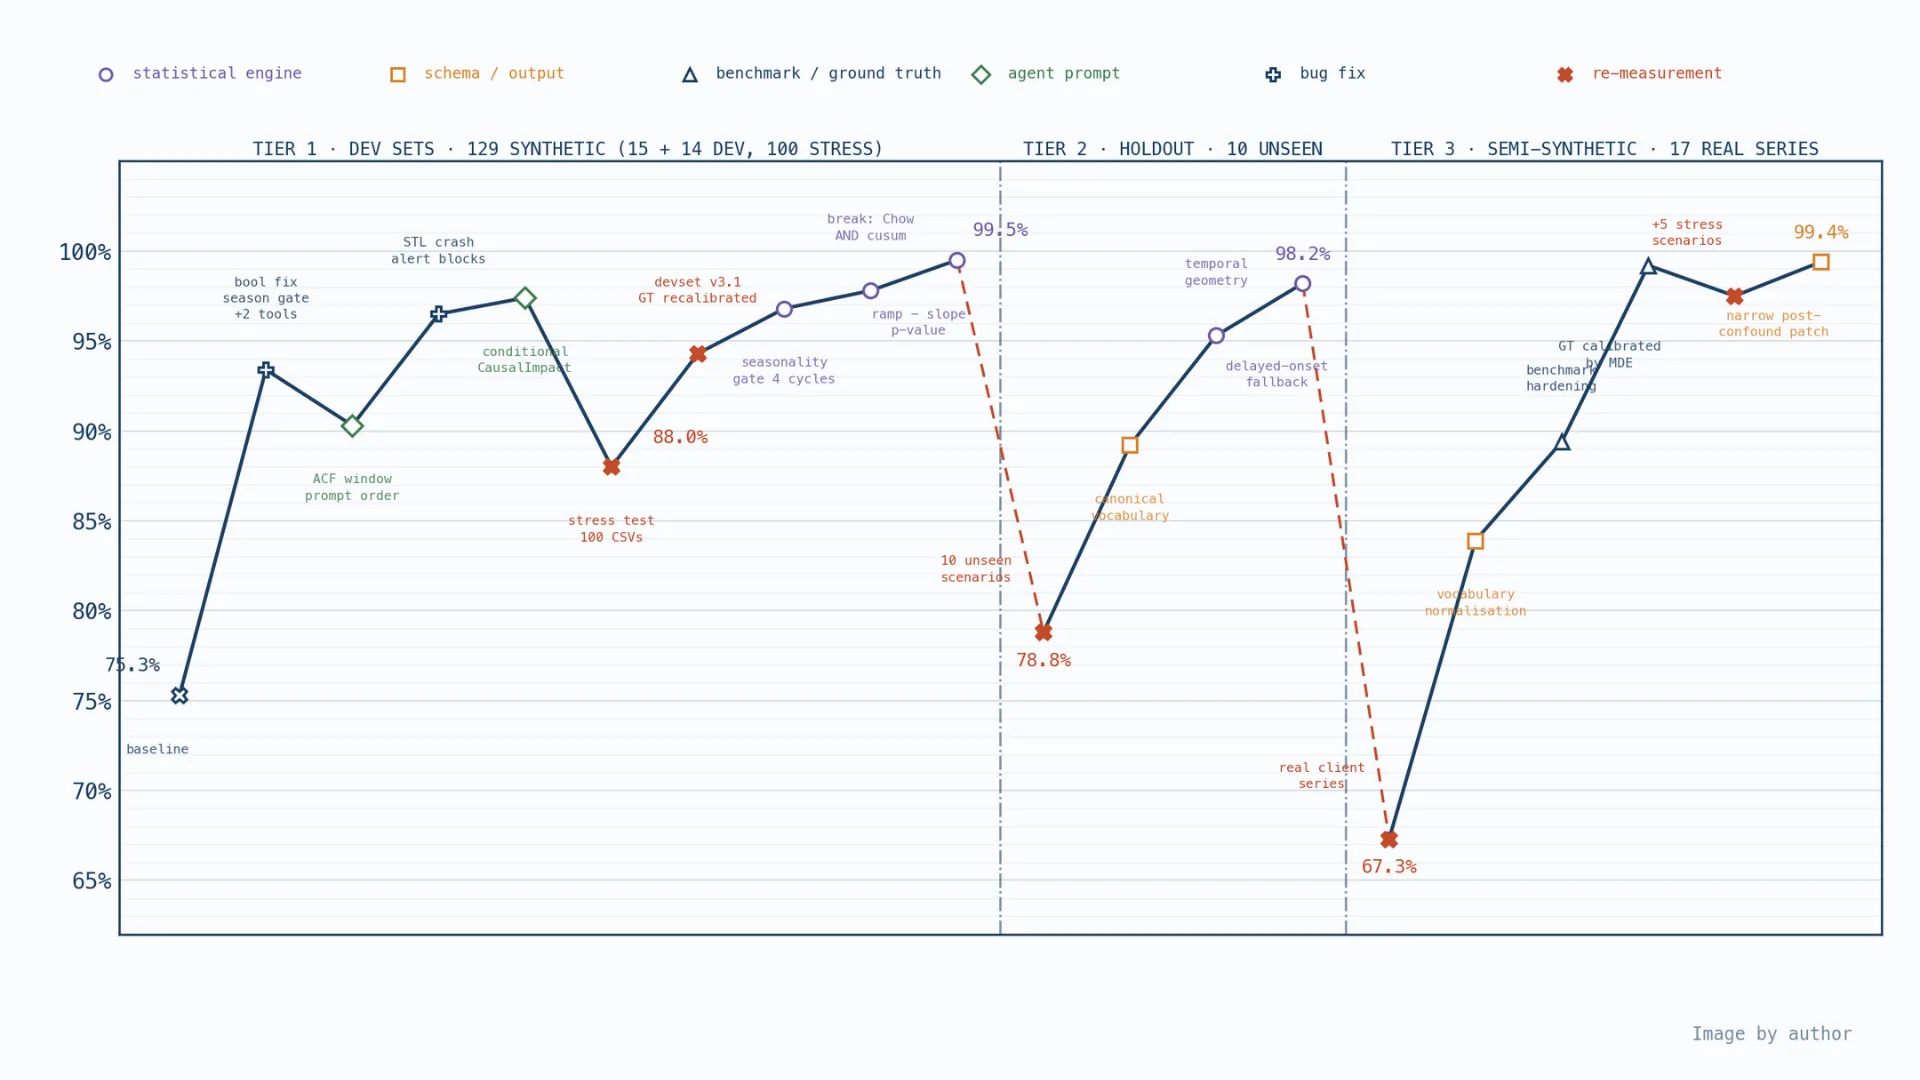
To validate ITSAgentic’s reliability, developers adapted evaluation loops modeled after advanced automated research frameworks. Testing against more than 150 diverse datasets (synthetic, semi-synthetic, and real-world cases), the system underwent rigorous iterative refinement:
- Tier 1 (129 Synthetic Development Sets): Climbed from a 75.3% baseline to 99.5% accuracy through targeted bug fixes, structural-break rules, and seasonality gates.
- Tier 2 (10 Unseen Holdout Scenarios): Validated robustness against temporal-geometry overrides.
- Tier 3 (17 Semi-Synthetic Series on Real Data): Achieved 99.4% alignment through semantic tuning and vocabulary standardization.
Evaluations combined 40% deterministic checks (verifying directional accuracy, magnitude thresholds within $pm 30%$ of ground truth, and correct stationarity classification) with a 60% LLM judge score measuring diagnostic quality, caveat transparency, and executive communication.
Official Architecture: Two Agents, One Contract
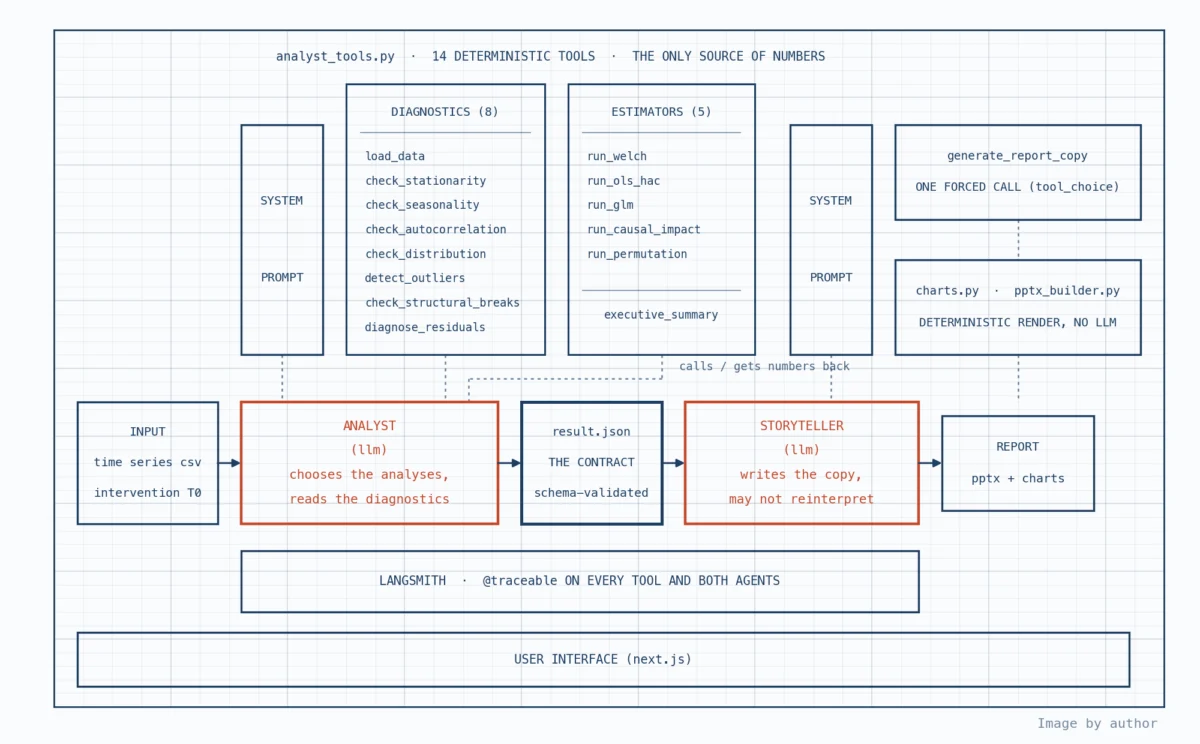
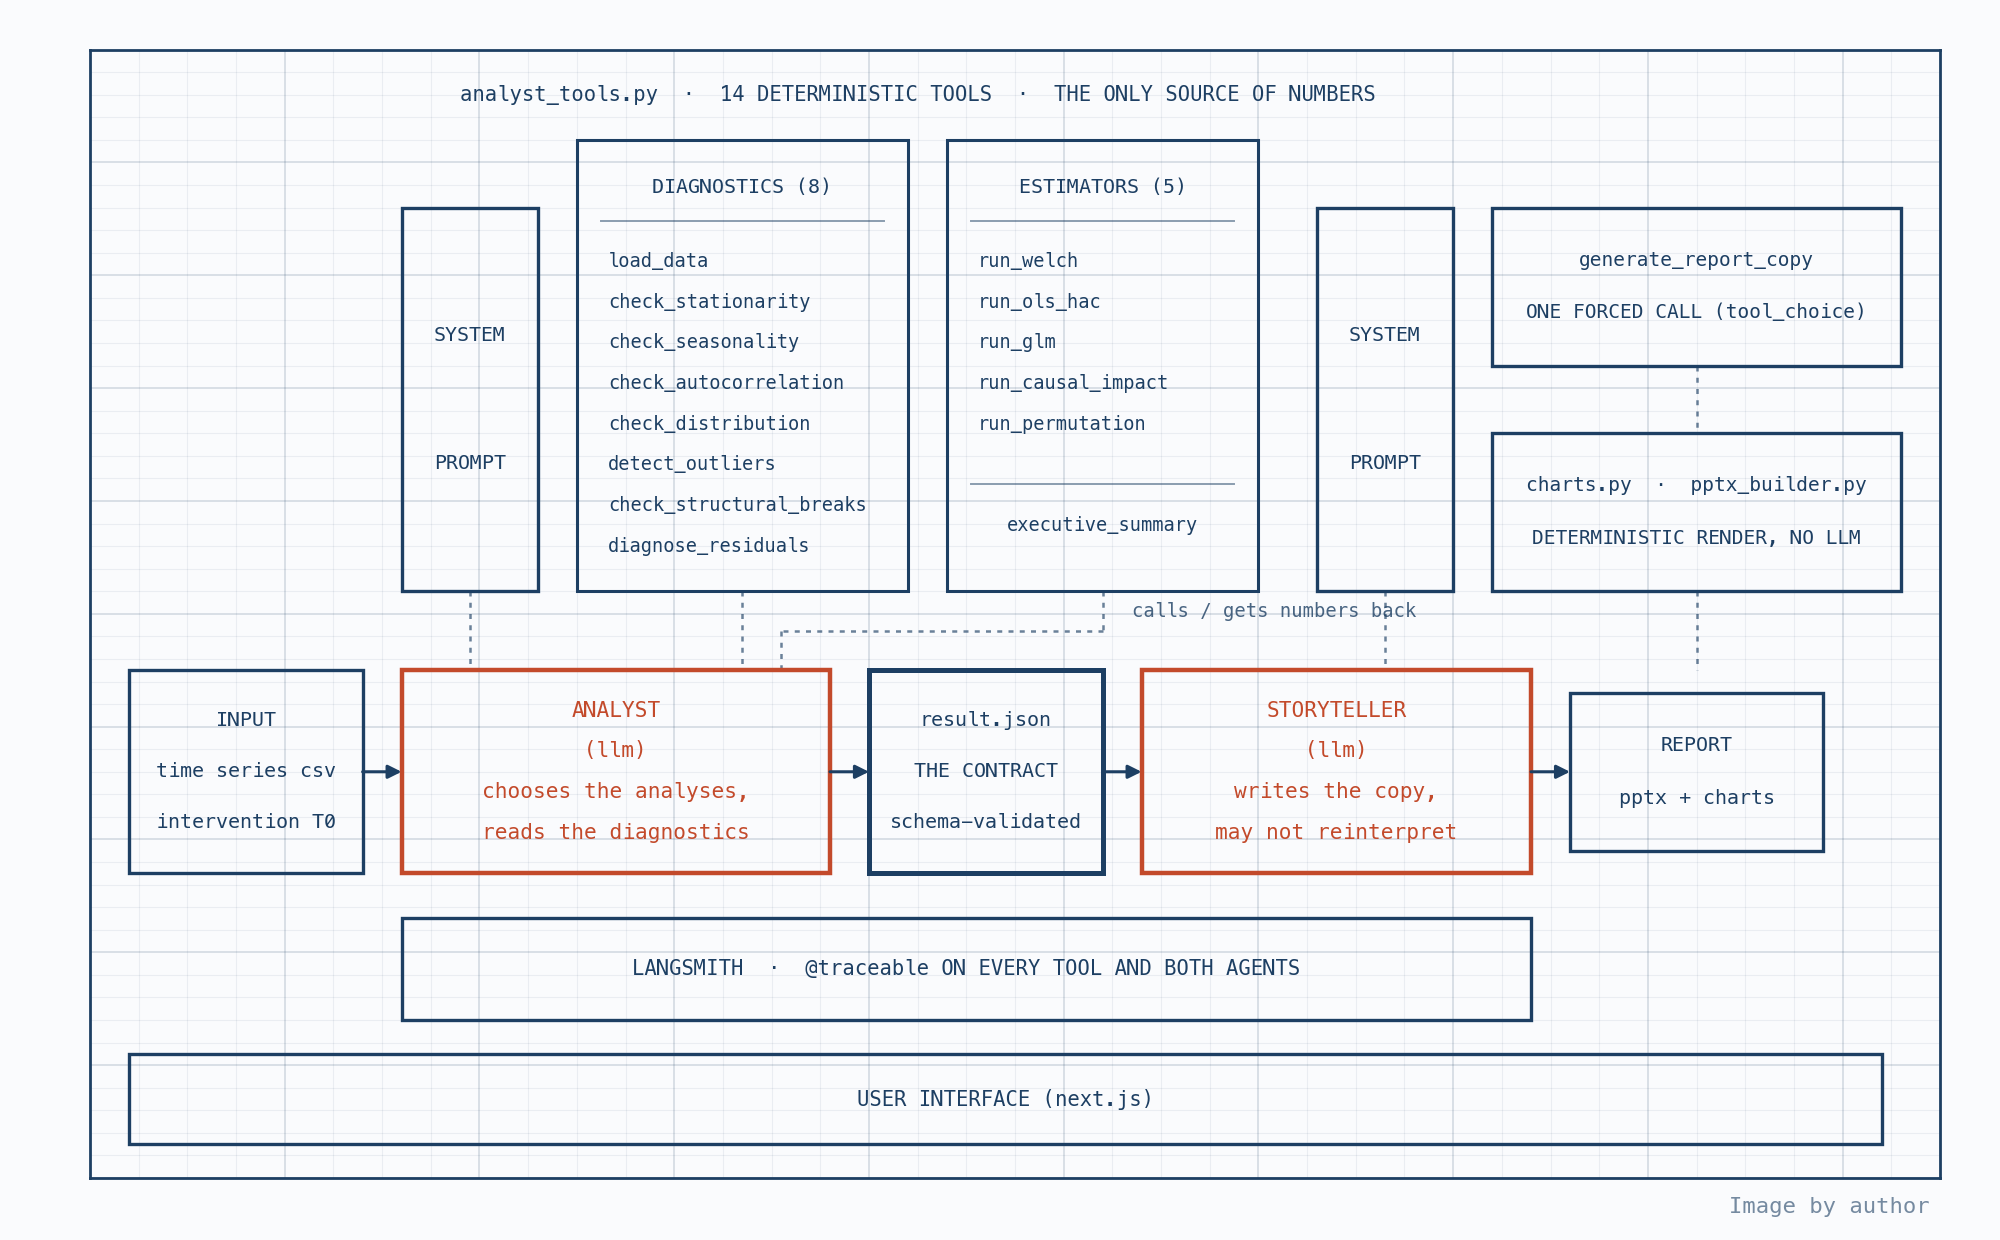
The engineering triumph of ITSAgentic lies in its decoupled, multi-agent architecture designed to eliminate hallucinations while maximizing operational speed.
[ Raw CSV Data + Intervention Parameters ]
                  │
                  ▼
       ┌─────────────────────┐
       │ Quantitative Analyst │ (LLM Agent 1)
       └──────────┬──────────┘
                  │ Executes 14 Deterministic Tools
                  ▼ (statsmodels, scipy, pandas)
       ┌─────────────────────┐
       │    result.json      │ (The Strict Data Contract)
       └──────────┬──────────┘
                  │ Passes Schema-Validated Metrics Only
                  ▼
       ┌─────────────────────┐
       │   Storyteller Agent │ (LLM Agent 2)
       └──────────┬──────────┘
                  │ Renders Presentation Ready Copy
                  ▼
[ Stakeholder-Ready Presentation & Report ]
1. The Quantitative Analyst Agent
Operating through a strictly prescribed diagnostic sequence (load_data, check_stationarity, check_seasonality, check_autocorrelation), this agent evaluates the series health.
- The Core Design Rule: The model never computes a single number. All 14 underlying tools (encompassing ADF tests, KPSS tests, Durbin-Watson statistics, and HAC/GLM estimators) are written in plain, deterministic Python. The LLM is restricted to reasoning about tool outputs, selecting the optimal statistical model, and assessing diagnostic warnings. Arithmetic is left entirely to deterministic code.
- The Output Contract: The analyst concludes by writing a schema-validated JSON file (
result.json), which serves as the exclusive bridge between the quantitative engine and the presentation layer.
2. The Storyteller Agent
Operating with a distinct base prompt and persona, the storyteller translates dry econometric outputs into executive-friendly narratives.
- Crucial Architectural Safeguard: The storyteller agent never accesses the raw dataframe, never reviews raw tool outputs, and never runs statistical models. It reads only
result.jsonand executes a forced call to generate presentation copy. Consequently, it cannot quietly drop vital warnings, inflate effect sizes, or turn a statistically insignificant result into a false win.
Handling Real-World Complexity: Exposure Shares
Traditional ITSA codes interventions as a binary $0/1$ dummy variable—off before $T_0$, fully active afterward. However, digital interventions rarely launch as instant, blanket switches. Staged rollouts, traffic throttling, and gradual market expansions create transitional phases.
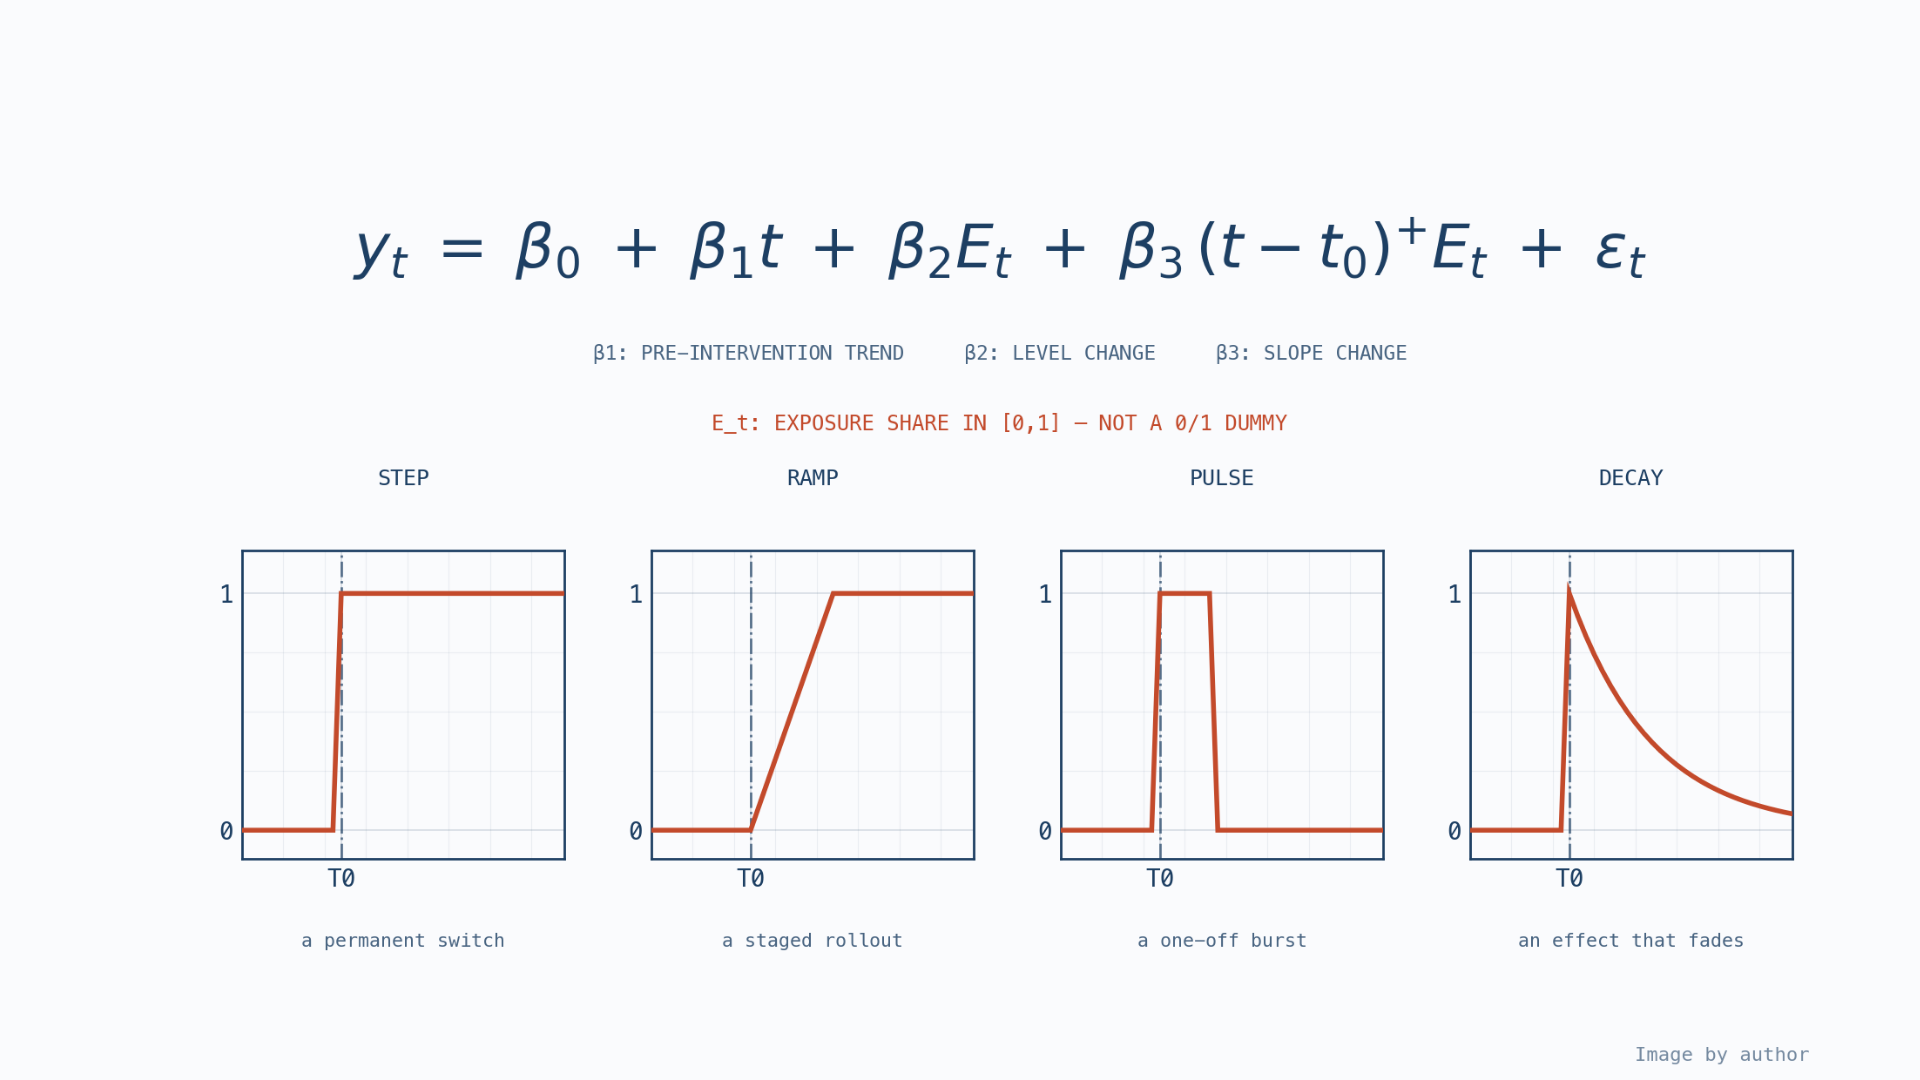
ITSAgentic solves this by modeling interventions through an exposure share ($E_t$) ranging between $0$ and $1$, categorized into four distinct shapes:
- Step: A permanent, stepped rollout.
- Ramp: A staged, linear audience expansion.
- Pulse: A temporary, time-bound campaign burst.
- Decay: An intervention whose initial impact gradually fades.
By weighting daily observations by actual audience exposure, the model prevents the dilution bias that typically occurs when untreated early users are misclassified as fully treated cohorts.
Implications: The Strategic Trojan Horse of Counterfactuals
While ITSA remains a step below randomized trials in the strict econometric hierarchy—susceptible to unobserved concurrent shocks and linear extrapolation errors when true counterfactuals bend—its organizational utility is profound.
Democratizing Executive Analytics
Historically, counterfactual reasoning sat imprisoned behind elite data science teams. By wrapping rigorous econometrics in an automated, AI-driven interface, product managers and marketing leads can upload CSVs, declare intervention parameters, and receive defensible, audit-ready impact assessments in minutes.
Building Organizational Credibility
ITSA offers an approachable narrative bridge: one line for what happened, one line for what would have happened, and the effect is the gap. When non-technical stakeholders grasp counterfactual thinking at an intuitive level, organizations naturally cultivate the appetite for more advanced, tightly identified causal designs.
Generative AI makes sophisticated data products scalable, but sustainable architecture demands uncompromising discipline. By keeping analytical execution strictly deterministic while reserving generative intelligence exclusively for reasoning and communication, ITSAgentic establishes a blueprint for trustworthy enterprise AI—proving that speed and statistical rigor can finally coexist in the modern digital enterprise.