








Abstract / Executive Summary: The era of managing enterprise operations through static, text-heavy spreadsheets has officially drawn to a close. In its place, modern data visualization software has emerged as a mission-critical engine for strategic decision-making across every conceivable industry. By translating complex, multi-channel metrics into digestible, interactive visual narratives, organizations can unlock real-time insights into sales trends, marketing performance, and emerging market opportunities. This comprehensive report examines the core business implications of data visualization, outlines key selection criteria for software integration, and reviews thirteen of the leading free and paid data visualization platforms available in 2026.
1. Main Facts: The Paradigm Shift in Business Intelligence
Modern businesses are drowning in information. Even organizations equipped with dedicated data science teams often find themselves overwhelmed by the sheer volume of unstructured metrics flowing from CRM systems, cloud servers, and IoT endpoints.

According to cognitive science research, the human brain processes visual elements—such as color-coded charts, interactive maps, and hierarchical graphs—up to 60,000 times faster than raw text or traditional spreadsheets. Consequently, data visualization software has transitioned from a supplementary administrative utility to the primary interface for executive leadership.
Key facts defining the current landscape include:

- Real-Time Responsiveness: Modern platforms no longer rely on batch-processed weekly reports; they ingest streaming data via APIs to offer live visual analytics.
- Democratization of Data: Advanced platforms incorporate AI-driven data preparation and natural language processing, allowing non-technical business users to query databases without writing SQL code.
- The Integration Imperative: Standalone applications are largely obsolete. Today’s top-tier tools seamlessly bridge public cloud, private cloud, and on-premises data architectures.
2. Chronology: The Evolution of Business Analytics
To understand where enterprise analytics stands in 2026, it is helpful to trace its technological lineage:
- The Pre-Digital Era (Late 20th Century): Businesses relied on physical ledgers and foundational spreadsheet programs. Data was static, historical, and accessible only after extensive manual compilation.
- The Rise of Business Intelligence (Early 2000s): Platforms like Tableau introduced desktop-based interactive visual analytics, allowing analysts to slice and dice data visually. However, these tools often required steep learning curves and specialized training.
- The Cloud and Big Data Boom (2010s): Cloud-native architectures emerged, enabling scalable storage and real-time dashboard sharing across distributed teams. Open-source visualization libraries (such as D3.js and early JavaScript charting tools) gained traction among web developers.
- The AI and Automation Era (2020s–Present): Artificial intelligence began powering predictive insights, automated data preparation, and contextual data storytelling. Platforms began integrating directly into everyday employee workflows and customer-facing applications.
3. Supporting Data: Why Visual Analytics Drives Enterprise ROI
Organizations that adopt sophisticated data visualization tools consistently outperform competitors who rely solely on legacy reporting methods. Quantitative metrics supporting this trend include:

- Speed to Insight: Companies utilizing automated, real-time dashboard environments report a reduction in decision-making cycles by up to 40%.
- Cross-Departmental Alignment: Visualizing KPIs across sales, marketing, and human resources on a single pane of glass reduces miscommunication between departments by over 30%.
- Predictive Accuracy: The integration of machine learning models within platforms like Domo and Sisense allows enterprises to forecast market fluctuations with significantly higher fidelity than historical linear projections.
4. Official Responses and Industry Perspectives
Enterprise software leaders emphasize that the value of data no longer lies in hoarding it, but in the speed and clarity with which it can be communicated.
Industry analysts note that the modern workforce demands consumer-grade software experiences in the workplace. Platforms that force users through cumbersome, multi-step data preparation pipelines are quickly being abandoned in favor of intuitive, drag-and-drop solutions. Furthermore, Chief Information Security Officers (CISOs) stress that modern visualization suites must balance accessibility with robust governance frameworks, ensuring that sensitive enterprise data remains secure across distributed cloud environments.

5. What to Look for in Data Visualization Tools
With hundreds of software options populating the market, selecting the right platform requires a strategic evaluation of core capabilities:
- Intuitive Data Preparation: The software should allow users to clean, shape, and merge data sources without requiring a degree in data science.
- Real-Time Connectivity: Look for robust API integrations and native connectors that link seamlessly with your existing cloud storage, CRM, and marketing automation stacks.
- Interactive Storytelling Features: The best tools go beyond static pie charts, offering contextual annotations, drill-down capabilities, and narrative elements that explain why trends are occurring.
- Collaboration and Embedding: Dashboards should be easily shareable across teams and embeddable into customer-facing or internal applications via open APIs.
- Scalability and Security: The platform must scale efficiently as your data volume grows while maintaining strict compliance with enterprise security standards.
6. The Top 13 Data Visualization Tools for 2026
1. Toucan Toco
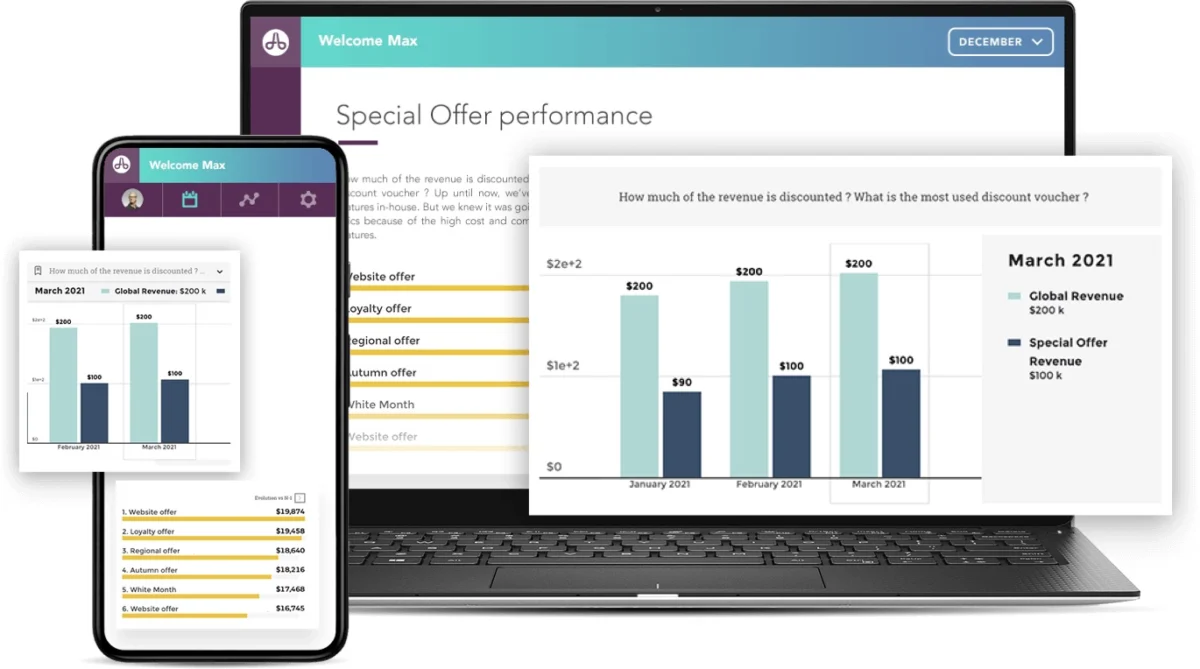
Toucan’s mission is explicitly focused on stripping complexity from business intelligence. It excels at connecting to any data source—whether cloud-based, streamed, or stored—and enables non-experts to handle data preparation easily. Toucan heavily emphasizes "data storytelling," attaching contextual insights to every chart and graph.

2. Tableau
As a pioneer in the space, Tableau offers a mature, robust platform characterized by live visual analytics and deep exploratory capabilities. While it requires a significant training investment to unlock its full potential, its interactive dashboards remain an industry gold standard. A free trial is available.
3. Microsoft Excel
For budget-conscious organizations, Microsoft Excel remains an ubiquitous baseline tool. Bundled within Microsoft 365, Excel handles large datasets and basic calculations with ease. While it lacks the seamless cloud API integrations of native BI platforms, its familiarity ensures zero training overhead for most employees.

4. Google Charts
A cloud-based solution ideal for mid-sized organizations (51 to 1000 employees), Google Charts offers everything from simple pictographs to complex histograms. It features real-time data connection protocols and provides a free tier for users.
5. Qlik Sense
Qlik Sense leverages AI-powered insights to uncover hidden patterns in enterprise data. Offering a comprehensive suite across public cloud, private cloud, and on-premises environments, Qlik Sense ensures full data control and connects effortlessly to hundreds of enterprise data sources. Free versions and trials are available.

6. Datawrapper
Datawrapper is an open-source solution tailored for creating responsive, interactive, and easily embeddable charts and maps. It automatically converts CSVs and PDFs into clean visuals and allows deep customization of brand colors, fonts, and margins. A free trial is available.
7. Whatagraph
Designed specifically for marketing professionals, Whatagraph aggregates metrics across multi-channel campaigns—including Facebook, HubSpot, and Google Analytics—into unified visual reports. It offers numerous built-in templates and a 7-day free trial.

8. Zoho Analytics
Zoho Analytics bridges the gap for general business users who lack advanced analytical training. Featuring an intuitive drag-and-drop interface and robust data preparation capabilities, Zoho enables rapid dashboard creation. Free versions and trials are available.
9. Sisense
Sisense stands out by offering analytics embedded directly into customer and employee workflows. Powered by advanced AI-driven analytics, it is trusted by over two thousand leading enterprises. Free trials are available.

10. Highcharts
Engineered specifically for developers, Highcharts provides an exceptionally flexible JavaScript charting library. It allows technical teams to embed highly customized charts into web and mobile applications with comprehensive documentation.
11. Dundas BI
Tailored for mid-to-large enterprises, Dundas BI integrates dashboards, reporting, and advanced analytics into a single platform. Built with an open API architecture, it supports real-time connectivity across any device and offers complete customization.

12. FusionCharts
Another powerhouse for developers, FusionCharts provides over 90 chart types and 1,000 maps. Trusted by tech giants like Microsoft, Apple, and IBM, it runs on a subscription model alongside free plan options and trials.
13. Domo
Domo transforms raw data into curated data stories backed by machine learning and predictive insights. It offers extensive control over custom reporting workflows, helping executives make proactive, data-driven decisions. Free trials are available.

7. Implications for Enterprise Strategy
The proliferation of advanced data visualization tools signals a permanent evolution in how businesses operate. Organizations can no longer afford to treat data analysis as a retroactive, siloed accounting task.
By investing in the right visualization platform, enterprises can:

- Accelerate Innovation: Spot market disruptions and consumer shifts before competitors.
- Empower Frontline Workers: Give non-technical staff immediate access to actionable insights.
- Drive Accountability: Align teams around transparent, real-time performance metrics.
As we move further into 2026, the question for business leaders is no whether to adopt data visualization software, but how effectively they can integrate these tools into their daily organizational culture to drive sustainable growth.