








SAN FRANCISCO — In the fast-paced world of modern software engineering, clear technical documentation can mean the difference between a seamless product deployment and a catastrophic system outage. Yet, for decades, creating and maintaining system architecture diagrams has been a notorious bottleneck for engineering teams.
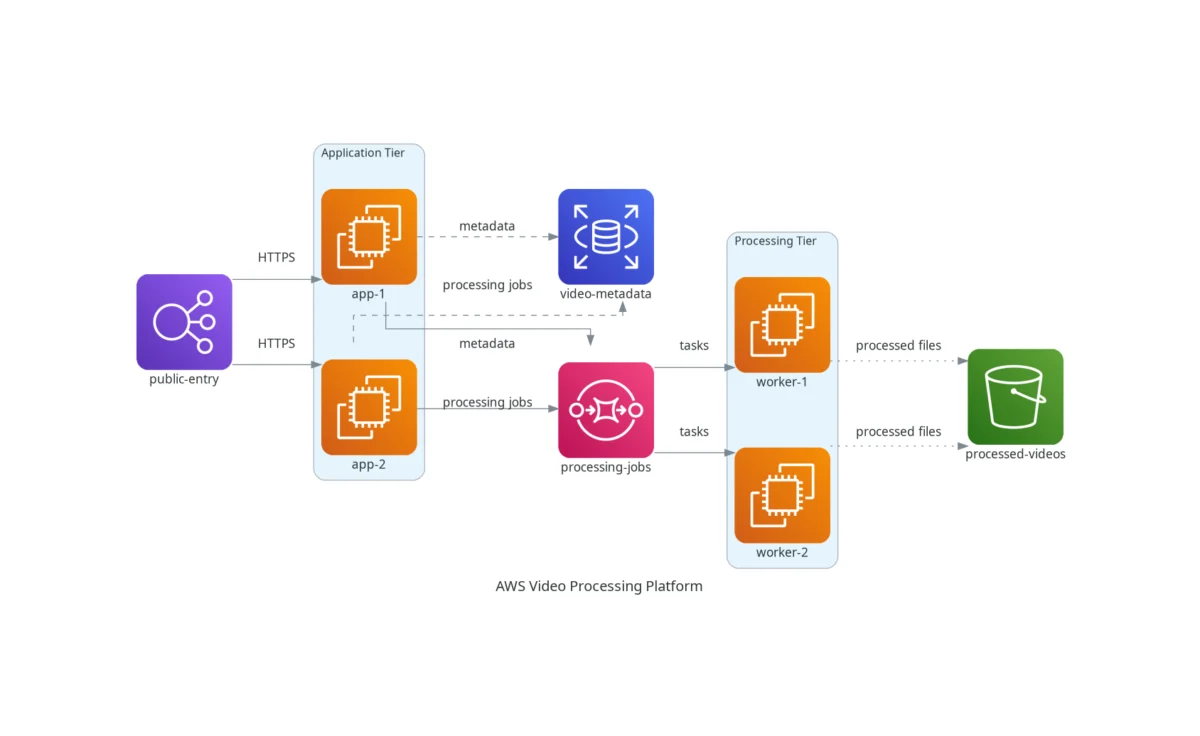
Enter the "diagram-as-code" movement—a paradigm shift that is rapidly replacing traditional drag-and-drop canvas tools with programmatic code generation. Leading this charge is Diagrams, an open-source Python library created by Mingrammer that allows developers to design complex cloud infrastructure architectures using clean, readable Python scripts.

As system complexity continues to scale alongside microservices and multi-cloud environments, the software industry is increasingly embracing text-based, reproducible workflows for architecture design. By treating system diagrams like application code, teams can now version-control, automate, and iterate on their architectural blueprints with unprecedented precision.
Main Facts: The Rise of Diagram-as-Code
For years, software architects and technical writers have relied on visual graphic editors like Visio, Lucidchart, or Draw.io to map out cloud topologies. While these tools offer creative freedom, they suffer from significant friction in collaborative development environments:
- Maintenance Overhead: When infrastructure changes, manual diagrams must be updated by hand, leading to out-of-date documentation that confuses engineering teams.
- Lack of Version Control: Binary or proprietary diagram formats do not play well with Git workflows, making it difficult to track architectural changes through pull requests or review history.
- Inconsistent Styling: Manual layout adjustments often result in messy, misaligned boxes and crossed connection lines, degrading the professional quality of technical documentation.
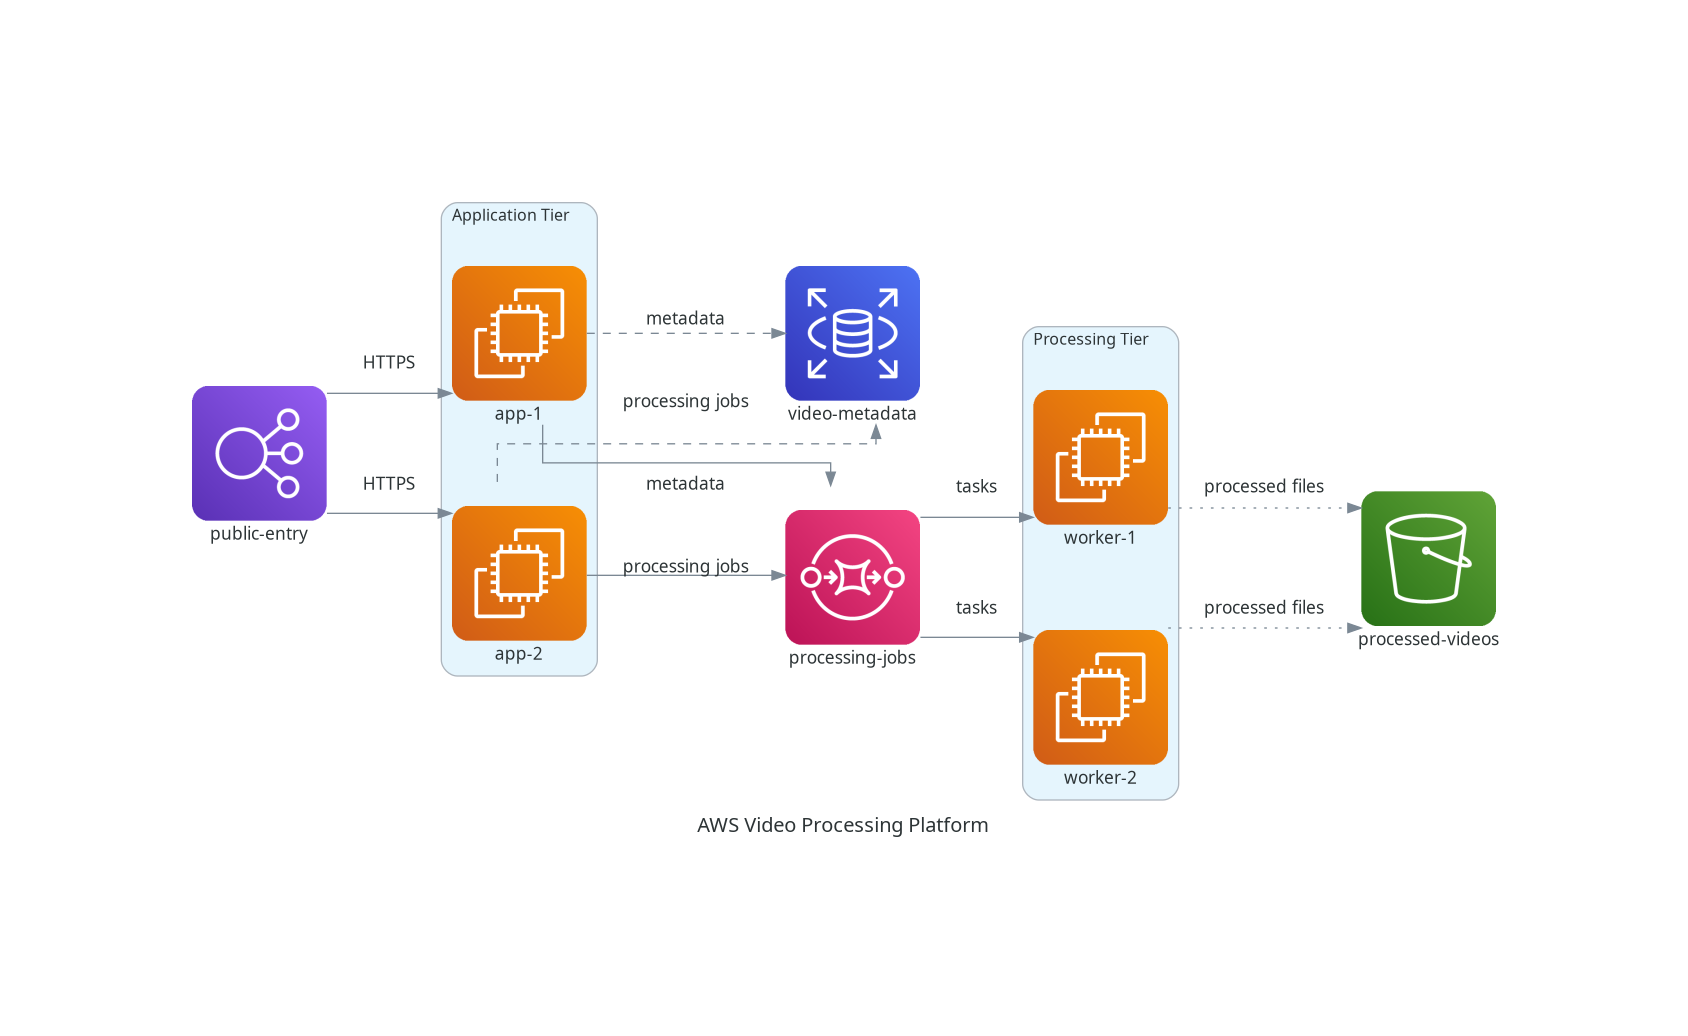
The Diagrams library addresses these pain points by abstracting the layout and rendering process entirely. Leveraging Graphviz under the hood, the Python library accepts simple syntax declarations for nodes, clusters, and edges, automatically rendering pristine, publication-ready architecture diagrams.
Crucially, the library supports official provider icons across major cloud ecosystems—including Amazon Web Services (AWS), Google Cloud Platform (GCP), Microsoft Azure, Kubernetes, and on-premises infrastructure—allowing developers to maintain visual accuracy alongside their actual cloud configuration files.

Chronology: From Visual Canvas to Programmatic Modeling
The evolution of technical documentation tools has closely mirrored the broader software engineering trend toward "Infrastructure as Code" (IaC) tools like Terraform and AWS CloudFormation.
- The Era of Static Drawing Tools: In the early 2000s, desktop applications dominated system design, requiring manual shape placement and connection routing.
- The Rise of Collaborative Web Tools: The 2010s saw a migration toward cloud-native vector editors, improving team collaboration but failing to solve the fundamental problem of synchronization between code and documentation.
- The Diagram-as-Code Breakthrough: With the maturation of tools like Mermaid.js for sequence charts and Mingrammer’s Diagrams library for cloud infrastructure, developers gained the ability to generate complex network topologies natively within programming workflows.
- Current State: Today, integration with CI/CD pipelines allows engineering teams to automatically regenerate architecture diagrams whenever core infrastructure definitions change, ensuring that documentation is always up to date.
Supporting Data & Technical Deep Dive: Getting Started with Diagrams
To understand how programmatic architecture works in practice, consider the transition from manual drawing to defining resources in Python.

Prerequisites and Installation
Before generating your first diagram, ensure your local development environment meets the following requirements:
- Python 3.6 or higher installed on your system.
- Graphviz installed and added to your system’s PATH, as it serves as the underlying rendering engine.
- The Diagrams library itself, installed via pip:
pip install diagrams
Your First Diagram: A Single Node
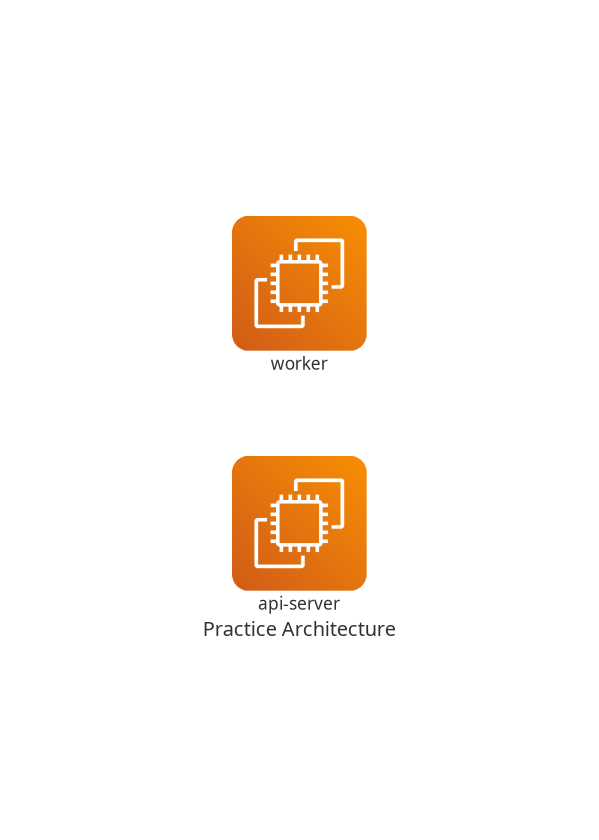
Creating a basic diagram requires importing the Diagram context manager and the specific resource class you wish to display. For instance, to represent a single AWS EC2 API server:
from diagrams import Diagram
from diagrams.aws.compute import EC2

with Diagram("Practice Architecture"):
    EC2("api-server")
When executed via python script.py, this script generates an image file in the local directory. The Diagram object acts as a global canvas context, while the EC2 class acts as a node—representing a discrete component characterized by its provider (aws), resource type (compute), and label (api-server).
Expanding and Connecting Nodes
As systems scale, connecting components becomes essential. Diagrams utilizes intuitive operator symbols to define data flow and connection directions:
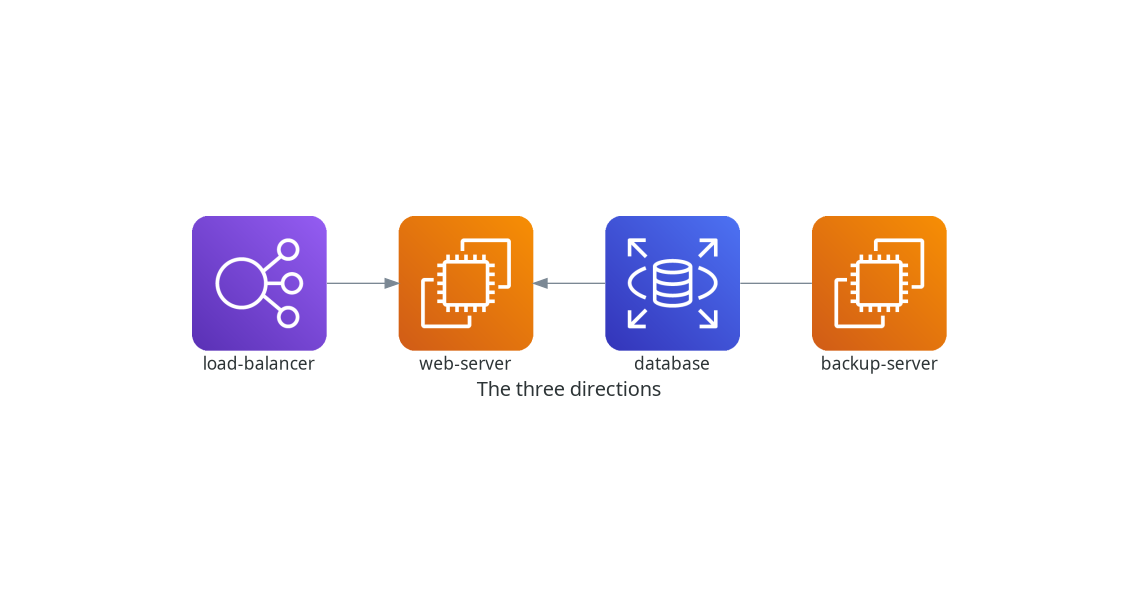
>>denotes a left-to-right or source-to-destination data flow.<<denotes a right-to-left flow.-creates a directionless connection (useful for peer-to-peer or backup relationships).
from diagrams import Diagram
from diagrams.aws.compute import EC2
from diagrams.aws.database import RDS
from diagrams.aws.network import ELB

with Diagram("The Three Directions"):
    load_balancer = ELB("load-balancer")
    web_server = EC2("web-server")
    database = RDS("database")
    backup_server = EC2("backup-server")

    load_balancer >> web_server
    web_server << database
    database - backup_server
Grouping and Scaling with Python Lists
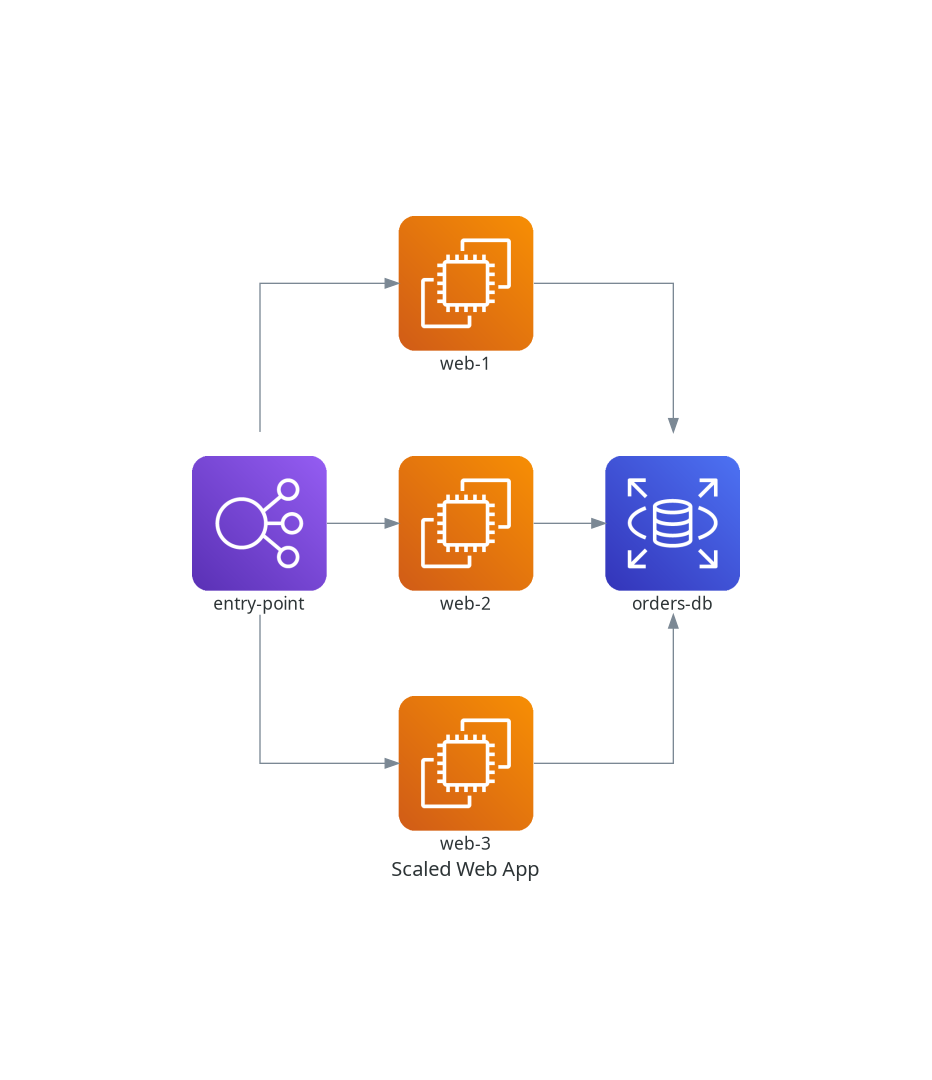
One of the primary efficiency gains of diagram-as-code is the elimination of repetitive boilerplate. By leveraging native Python data structures like lists, developers can map out scaled tiers without manually wiring every single node.
from diagrams import Diagram
from diagrams.aws.compute import EC2
from diagrams.aws.database import RDS
from diagrams.aws.network import ELB

with Diagram("Scaled Web App"):
    load_balancer = ELB("entry-point")

    web_servers = [
        EC2("web-1"),
        EC2("web-2"),
        EC2("web-3")
    ]

    database = RDS("orders-db")

    load_balancer >> web_servers >> database
Organizing Complex Topologies with Clusters
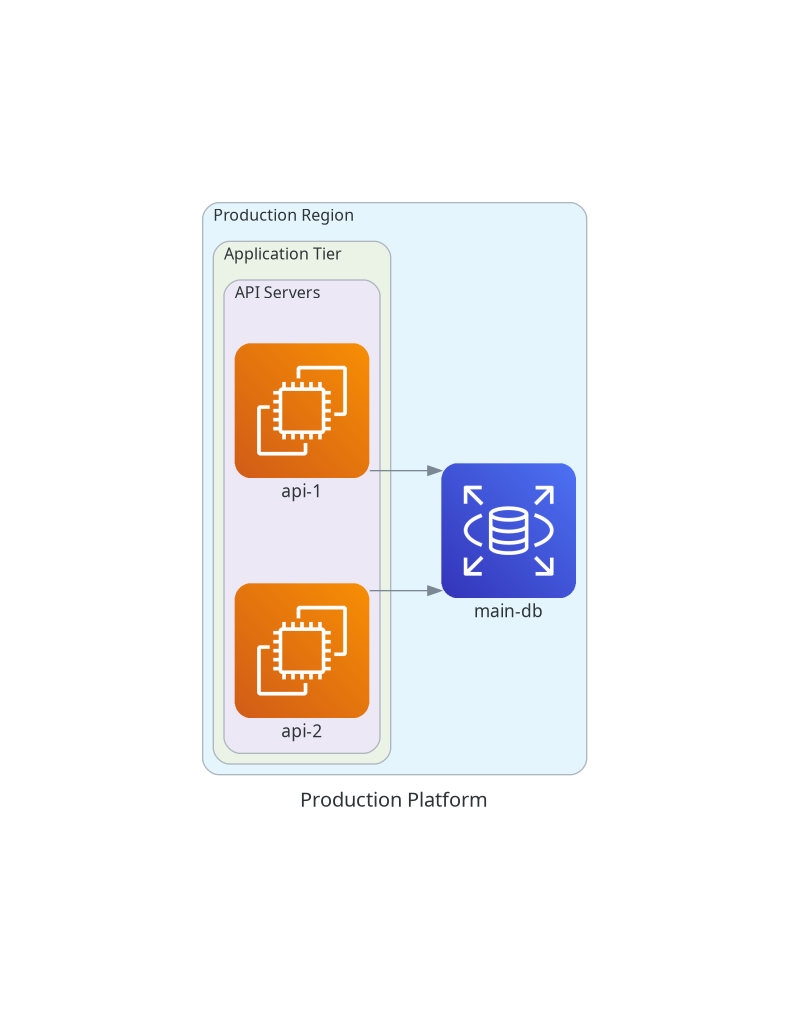
For enterprise-grade architectures featuring multiple tiers, Virtual Private Clouds (VPCs), or regional availability zones, the library provides a Cluster context manager. Clusters visually group related nodes inside labeled boxes, and can even be nested to reflect multi-layered enterprise environments.
from diagrams import Diagram, Cluster
from diagrams.aws.compute import EC2
from diagrams.aws.database import RDS

with Diagram("Production Platform"):
    with Cluster("Production Region"):
        with Cluster("Application Tier"):
            with Cluster("API Servers"):
                api1 = EC2("api-1")
                api2 = EC2("api-2")

        database = RDS("main-db")

        api1 >> database
        api2 >> database
Fine-Tuning Connections with Edges
When standard arrows are insufficient to convey complex data protocols, the Edge class allows developers to inject metadata directly into the connection lines. Properties such as custom labels, colors, and line styles (dashed, dotted, or bold) provide immediate visual context for security protocols, asynchronous queues, or database queries.
from diagrams import Diagram, Edge
from diagrams.aws.compute import EC2
from diagrams.aws.database import RDS

with Diagram("Payment Service"):
    api = EC2("payment-api")
    database = RDS("payments-db")

    api >> Edge(
        label="payment records",
        color="darkgreen",
        style="dashed"
    ) >> database
Official Responses and Industry Reception
Software engineers and technical documentation leads have widely praised the diagram-as-code approach for bridging the communication gap between development and operations (DevOps) teams.
Industry analysts point out that as modern enterprises shift toward GitOps—where infrastructure, configuration, and documentation are managed entirely through Git repositories—tools like the Python Diagrams library offer a missing link. By eliminating the friction of manual image editing, developers are far more likely to keep system documentation accurate and up to date.
Open-source maintainers emphasize that the extensibility of the library allows community contributors to continuously add custom icon sets for emerging technologies, Kubernetes operators, SaaS platforms, and on-premises hardware components, ensuring the tool remains future-proof.
Implications: The Future of Technical Communication
The widespread adoption of programmatic diagramming carries profound implications for the software development lifecycle:
- Enhanced Team Collaboration: Architecture diagrams can now be subjected to peer review. Team members can comment on pull requests suggesting structural changes, viewing architectural diffs line-by-line just as they would application source code.
- Automation and CI/CD Integration: Organizations can configure continuous integration pipelines to automatically build and publish updated architecture diagrams to internal wikis or developer portals whenever infrastructure code is merged to the main branch.
- Reduced Onboarding Friction: New software engineers often struggle to understand complex legacy systems due to outdated documentation. Automated, code-generated diagrams ensure that new hires are always greeted with an accurate representation of the system topology.
Ultimately, libraries like Diagrams signal a maturing ecosystem where administrative friction is systematically engineered out of technical documentation, empowering development teams to focus on building resilient, scalable systems.