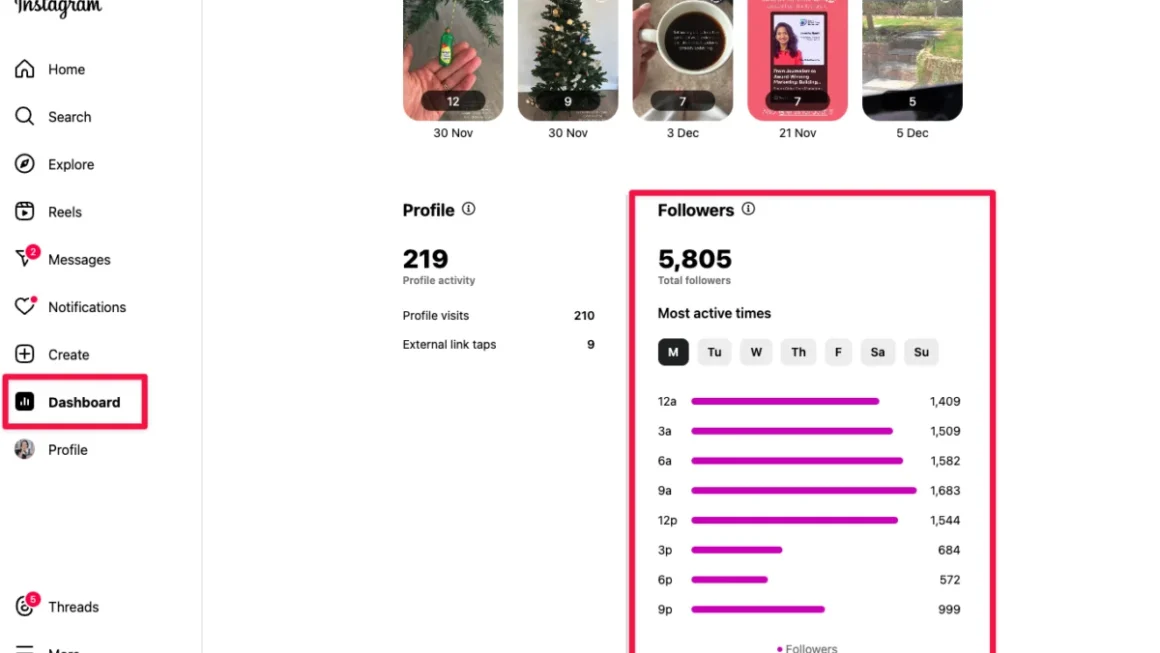










In the modern digital landscape, social media teams sit on a goldmine of information. Every day, they capture the pulse of the market—unfiltered, raw, and immediate. It is the world’s largest focus group, revealing customer pain points, product hacks, and sentiment shifts long before they appear in traditional CRM records or quarterly pipeline reports. Yet, there is a critical disconnect: according to the 2026 Social Intelligence Report, a staggering 64% of organizations fail to regularly integrate these insights into business decisions outside of the marketing department.
The numbers are there, but the impact is missing. When social engagement spikes or brand mentions soar, teams often find these metrics trapped within internal dashboards. To move the needle, social practitioners must pivot from being "data reporters" to "data storytellers."
The Core Challenge: Transforming Data into Action
Data storytelling is more than just creating a polished chart. It is the sophisticated fusion of data science, narrative structure, and visual design intended to explain not just what happened, but why it matters to the organization’s bottom line.
For many teams, the struggle is not a lack of data, but a failure of translation. When social data remains siloed, the business misses opportunities to optimize product roadmaps, pivot marketing strategies, or address customer service failures. An 86% segment of organizations report that they have forfeited significant business opportunities in the last two years simply because social insights were delayed, ignored, or lacked the narrative context required for executive buy-in.
The Chronology of an Insight
To understand why social data often dies in the reporting phase, one must look at the lifecycle of an insight:
- The Signal: A customer shares a creative "hack" for a product on social media.
- The Capture: The social team monitors the mention and observes a sentiment trend.
- The Stagnation: The data is compiled into a monthly report, often buried among vanity metrics like follower growth.
- The Failure: Because the report lacks a "so what" narrative, stakeholders in Product or R&D never see the potential for a feature update.
- The Missed Opportunity: A competitor notices the same trend, innovates, and captures the market interest that the original brand left on the table.
The Building Blocks of a Compelling Narrative
To break this cycle, social teams must adopt a rigorous framework for data storytelling. The goal is to move from "reporting" to "influencing."

1. Grounding Insights in Context
Numbers in a vacuum are meaningless. To make data land, you must provide the "why." If engagement is up, is it because of a viral meme, or because of a fundamental shift in user behavior? By pairing quantitative data (the "what") with qualitative data (the "why"—such as direct customer comments or screenshots), you build a narrative that is impossible to ignore.
2. Visualization with Purpose
Effective visualization is about reducing the cognitive load on your audience. If a chart requires a legend that is longer than the graph itself, it has failed. Use visuals to highlight the climax of your story—the turning point where the data changes the trajectory of the business.
3. The Narrative Arc
A professional data story follows the same architecture as a classic novel:
- The Scene: Establish the current baseline or the status quo.
- The Obstacle: Introduce the challenge or the market shift.
- The Climax: Present the "aha!" moment in your data.
- The Resolution: Offer a concrete, data-backed recommendation for how the business should respond.
A Strategic Framework for Implementation
To ensure that your data drives organizational change, follow this seven-step framework when preparing your reports or presentations.
Step 1: Identifying the Objective
Before you open your data tool, define your goal. Are you looking to justify an increase in advertising spend? Are you trying to convince the product team to fix a bug? Identifying your objective dictates which data points you choose to amplify.
Step 2: The "Second-Best" Hook
Command attention early. Do not start with your most powerful data point; save that for the climax. Start with a piece of information that validates what your audience already knows, then pivot to a surprising correlation that they hadn’t considered.
Step 3: Visual Integration
Use your visuals as the backbone of your presentation. When you mention that sales are up, show the graph. When you reveal the correlation between social traffic and those sales, overlay the social traffic data. The visual reinforcement makes the data tangible.
Step 4: Anticipating the Skeptics
Executives and cross-functional partners are trained to look for gaps. If you present a correlation, expect the question: "Is this causation?" By proactively addressing these challenges within your presentation, you demonstrate rigor and build trust.
Step 5: The Grand Finale
Save your most compelling insight for last. This is your "closer." If you have discovered that 33% of new customers are coming from a single influencer’s unprompted post, this is the moment to showcase the influencer’s sentiment and the direct path to revenue.
Step 6: The "So What?"
Every data story must end with a clear, actionable takeaway. If your data shows a rise in demand for a specific feature, your closing statement should be: "Based on this, I recommend we prioritize this feature in the Q3 roadmap to capture the projected $X in additional revenue."
Step 7: Avoiding Common Pitfalls
Avoid cluttering slides with too much information, using misleading axes, or failing to acknowledge the limitations of your data. Transparency creates credibility; hiding the weaknesses of your data only invites scrutiny that could derail your entire proposal.
Industry Examples of Success
Companies that have mastered this craft demonstrate that simplicity often beats complexity.
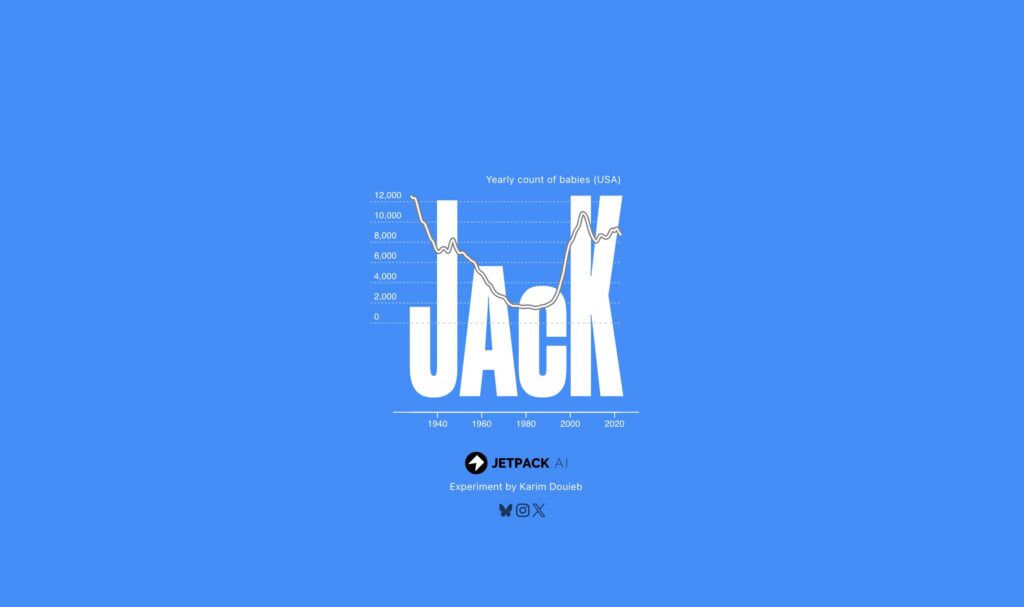
- Jetpack AI: Their baby name popularity tracker is a masterclass in interactive storytelling. By allowing users to input their own data, they foster a sense of personal investment, making the data feel alive rather than static.
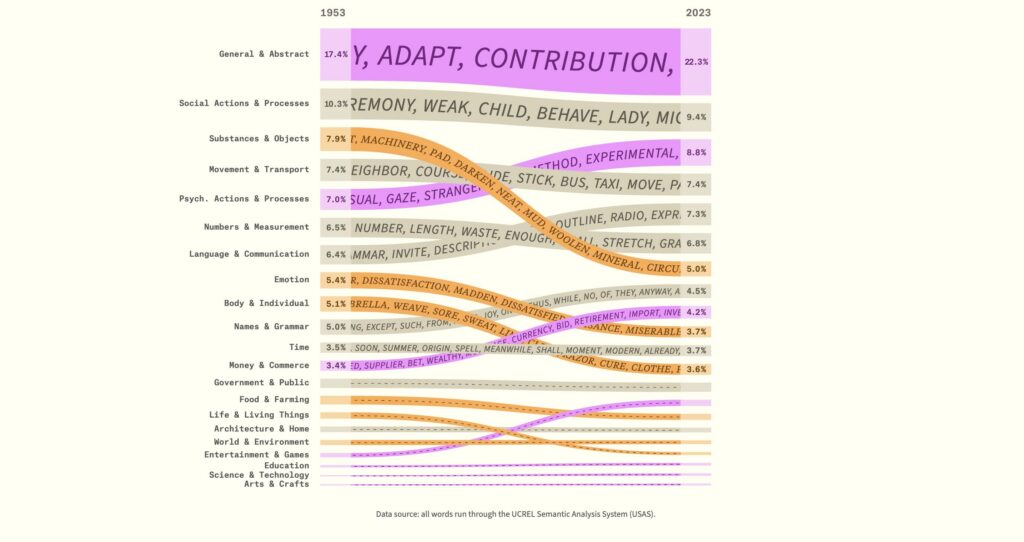
- The Pudding: Known for data journalism, The Pudding excels at using interactive, visual-heavy formats to explain complex cultural trends. They show that data can be entertaining, which is a powerful way to ensure your message is remembered long after the meeting ends.
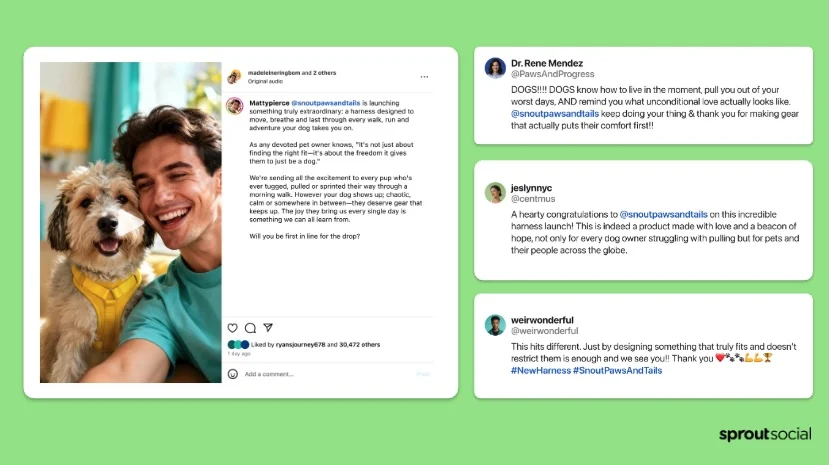
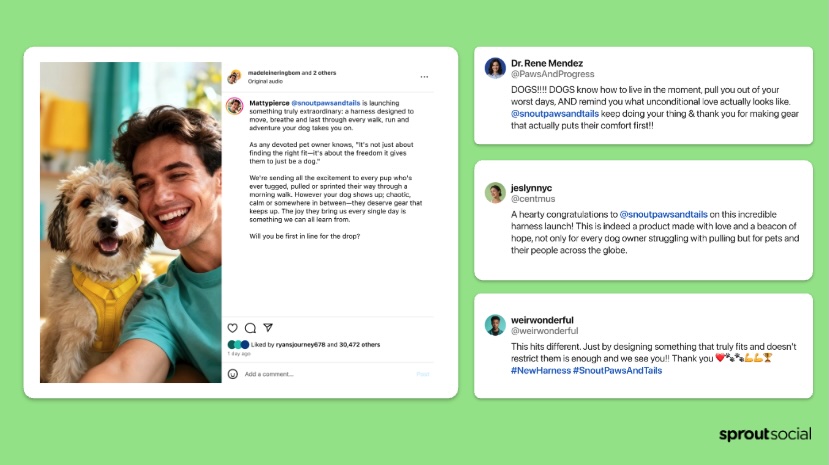
- Sprout Social: By integrating social listening with reporting, platforms like Sprout allow teams to bridge the gap between "what" (metrics) and "why" (contextual feedback), providing a template for how modern social intelligence should be conducted.
The Implications for Business Governance
The failure to tell stories with data is often a governance issue rather than a technical one. When insights are sequestered within the social media team, the organization is effectively operating with one eye closed.
To resolve this, companies should move toward a model of "Democratized Intelligence." This means creating regular cadences where social teams present not just to their managers, but to Product, Customer Success, and Executive leadership. When social data becomes a part of the boardroom conversation, it ceases to be a cost center and becomes a strategic asset.
Conclusion: Crafting a Story That Travels
A great data story does not stay in the room where it was presented. A truly impactful narrative is one that gets repeated in the hallways, referenced by the product team as the catalyst for a new feature, and quoted by executives when setting long-term strategy.
To get there, social practitioners must elevate their craft. It is no longer enough to report that "engagement is up." You must be able to articulate exactly what that engagement means for the business, why it matters today, and what the company must do to capitalize on it. By marrying the raw power of social intelligence with the art of narrative storytelling, social teams can finally claim their seat at the strategic table and turn momentum into lasting business success.
Frequently Asked Questions
What is the primary goal of data storytelling in marketing?
The primary goal is to bridge the gap between raw metrics and business strategy. It involves turning complex datasets into coherent, actionable narratives that help decision-makers understand the impact of social activities on revenue, retention, and brand health.
How can social teams effectively engage executives?
Executives prioritize the bottom line. To engage them, social teams must tie social metrics to business outcomes—such as linking response times to customer retention or social sentiment to sales pipeline growth—and provide this data in a concise, narrative-driven format.
What is the difference between a standard report and a data story?
A report provides a snapshot of "what" happened, usually in a neutral, data-heavy format. A data story adds the "why" and the "so what," using narrative structure to guide the reader toward a specific conclusion or recommended action.
Why is social media data considered more "unfiltered" than other sources?
Unlike CRM data or support tickets, which are typically generated after a formal transaction or inquiry, social media captures spontaneous, unprompted consumer reactions. This allows brands to see market sentiment and product issues in real-time, often before they manifest in formal feedback loops.
What are the most effective tools for this process?
The best tools are those that consolidate social listening, reporting, and visualization. Platforms that allow users to pull qualitative data (customer comments) and quantitative data (growth charts) into a single, cohesive view are essential for creating context-rich, actionable reports.