









In the fast-paced world of digital product development, the vocabulary of research is often weaponized. Teams frequently use the terms "data," "findings," and "insights" interchangeably, creating a linguistic fog that obscures the true value of user experience (UX) work. When a stakeholder asks, "Is this statistically significant?" during a design review, they are rarely asking for a lesson in p-values; they are often expressing a lack of confidence in the evidence provided.
To elevate the role of UX, practitioners must master the distinction between these three pillars. Understanding this hierarchy is not merely a technical exercise—it is a survival skill for designers looking to influence strategy and avoid the trap of having their recommendations dismissed as "subjective opinion."
The Hierarchy of Evidence: Data, Findings, and Insights
To communicate impact effectively, we must first categorize the raw inputs of our research.

1. Data: The Raw Material
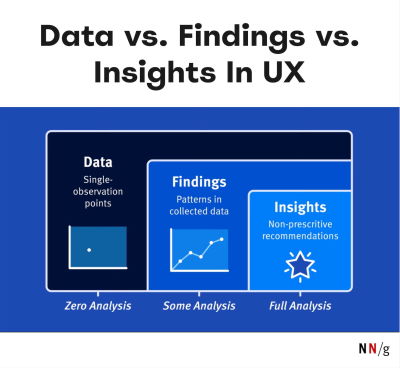
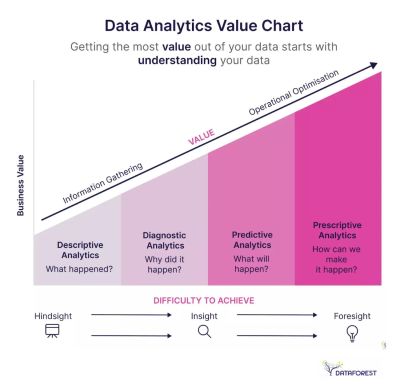
Data consists of the objective, granular facts collected during research. It is the "what." This includes heatmaps, raw session recordings, click-through rates, or a list of specific comments made by a participant during an interview. By itself, data is passive. It is a collection of observations that, in isolation, lacks context and meaning.
2. Findings: The Pattern
Findings are the result of synthesizing data. When you notice that 7 out of 10 users struggled to find the "checkout" button, you have moved from raw data to a finding. Findings represent the "what happened" consistently across multiple data points. However, a finding is still descriptive rather than prescriptive. It tells you the state of affairs but does not necessarily explain why it matters to the business.
3. Insights: The Strategic Pivot
Insights are the highest order of research output. An insight provides a new understanding of the user’s behavior that allows for a shift in strategy. It answers the "So what?" question. An insight isn’t just that users struggle to find the checkout button; it is the realization that the current navigation structure fundamentally contradicts the user’s mental model of how they want to pay, resulting in a 15% drop-off rate that directly impacts quarterly revenue.
Chronology of Research: From Observation to Action
The journey from raw data to a strategic decision follows a distinct chronological path. Understanding this flow helps researchers maintain rigor throughout the project lifecycle.
- Collection (The Raw Phase): During the initial research phase, the focus is on gathering high-quality, unbiased data. At this stage, the researcher acts as a filter, ensuring the data is reliable.
- Synthesis (The Pattern Phase): Once the data is gathered, the researcher begins the thematic analysis. Here, sporadic observations are weeded out, and consistent patterns are identified. This is where "findings" are formulated.
- Articulation (The Insight Phase): The final step involves connecting these patterns to the business context. This is where the researcher crafts a narrative that links a specific user pain point to a business opportunity or risk.
- Strategic Deployment: Finally, the insight is presented to stakeholders to drive design changes, feature prioritization, or architectural shifts.
Navigating the "Statistical Significance" Trap
One of the most common hurdles for UX researchers is the defensive questioning of stakeholders, particularly when they demand statistical significance. This question is often used to discredit qualitative research, which is rarely designed to meet the rigorous requirements of quantitative, academic-grade testing.
Why It’s a Misnomer
As industry experts like Nikki Anderson have noted, statistical significance is a concept born from large-scale quantitative research. In the context of iterative UX design, we are usually conducting qualitative usability testing. Our goal is not to prove a universal truth that applies to the entire global population, but to reach theoretical saturation.
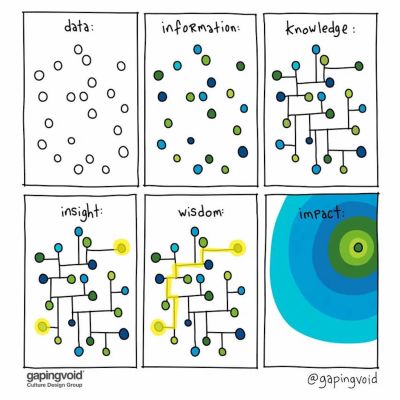
Theoretical saturation is the point at which further research stops yielding new, meaningful information. Once you see the same issues repeating, you have found the signal; continuing to test for the sake of increasing a sample size is often a waste of resources.
Counter-Arguments for Researchers
When challenged on the reliability of your findings, you should pivot the conversation toward the cost of inaction. Use these talking points to defend your work:
- "We aren’t measuring a population; we are identifying systemic blockers." Explain that your goal is to identify barriers to entry, not to perform a census.
- "The severity of the issue outweighs the sample size." If a critical user flow is broken, it doesn’t matter if you found it with five users or fifty—the risk to the business remains identical.
- "Focus on the ‘Why’." When you shift the discussion from the number of participants to the clear, consistent struggle of the users, you make the data harder to ignore.
Framework: Turning Findings into Insights
To avoid the common mistake of presenting "data dumps" to stakeholders, utilize the "What Happened + Why + So What" framework. This structure ensures that your reporting is always actionable.
- What Happened: State the observation clearly and concisely. (e.g., "Users are abandoning the registration flow at the identity verification step.")
- Why: Explain the root cause based on your research. (e.g., "The UI fails to explain why the user needs to provide their tax ID, leading to privacy concerns and suspicion.")
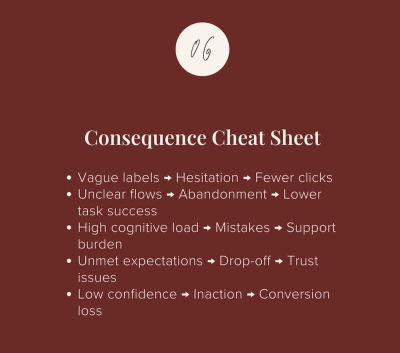
- So What: Connect the finding to the business goal. (e.g., "This friction is likely responsible for our 12% lower conversion rate compared to our main competitor. By adding a contextual tooltip explaining the security of this data, we can reduce abandonment and increase sign-ups.")
This framework moves the conversation away from "the users said this" toward "this is the business impact of the current design."
Implications for UX Leadership
The ultimate goal of a UX professional is to stop being a "provider of findings" and start being a "driver of insights." When you focus on actionable recommendations, you change the nature of your relationship with your stakeholders. You are no longer the person who brings them "bad news about usability" but the person who brings them "opportunities for growth."
The Art of Storytelling
Data is cold; stories are compelling. To make your insights stick, you must paint a picture of the future. Describe what the user experience could look like if the insight is acted upon. Use the research to tell a story that is:
- Memorable: Use a specific user narrative to humanize the data.
- Feasible: Ensure your recommendations account for technical and business constraints.
- Convincing: Link every recommendation back to a measurable business outcome.
Investing in Impact
The ability to measure and communicate the ROI of design is the most important skill a modern designer can possess. If you cannot explain the impact of your work in the language of the business—revenue, retention, efficiency, and risk mitigation—your insights will often be dismissed regardless of how valid they are.
As the industry matures, the distinction between those who merely observe and those who provide strategic foresight will only widen. By refining your methodology and mastering the art of the insight, you ensure that your design work remains a fundamental, irreplaceable part of the business strategy.
For those looking to bridge the gap between design and business, courses like "How to Measure UX and Design Impact" offer practical frameworks for quantifying the intangible. By learning to speak the language of stakeholders, you can ensure your research isn’t just heard, but acted upon.